Staged app rollout gated by Prometheus checks
Staged application rollout gated by Prometheus checks
This example lives in the pulumi/examples repository. Check out just this directory to use it:
git clone --filter=blob:none --sparse https://github.com/pulumi/examples pulumi-examplesgit -C pulumi-examples sparse-checkout set kubernetes-ts-staged-rollout-with-prometheuscd pulumi-examples/kubernetes-ts-staged-rollout-with-prometheusDemonstrates how to create a staged rollout (from 3-replica canary -> 10-replica staging), gated by
checking that the P90 response time reported by Prometheus is less than some amount. We first deploy
Prometheus using a Helm Chart, then deploy a Prometheus-instrumented application
using two Deployment objects, with a gated check between them.
The relevant gating code in index.ts looks like this:
// Canary ring. Replicate instrumented Pod 3 times.const canary = new k8s.apps.v1beta1.Deployment(    "canary-example-app",    { spec: { replicas: 1, template: instrumentedPod } },    { dependsOn: p8sDeployment });
// Staging ring. Replicate instrumented Pod 10 times.const staging = new k8s.apps.v1beta1.Deployment("staging-example-app", {    metadata: {        annotations: {            // Check P90 latency is < 100,000 microseconds. Returns a `Promise<string>` with the P90            // response time. It must resolve correctly before this deployment rolls out. In            // general any `Promise<T>` could go here.            "example.com/p90ResponseTime": util.checkHttpLatency(canary, containerName, {                durationSeconds: 60,                quantile: 0.9,                thresholdMicroseconds: 100000,                prometheusEndpoint: `localhost:${localPort}`,                forwarderHandle: forwarderHandle            })        }    },    spec: { replicas: 1, template: instrumentedPod }});
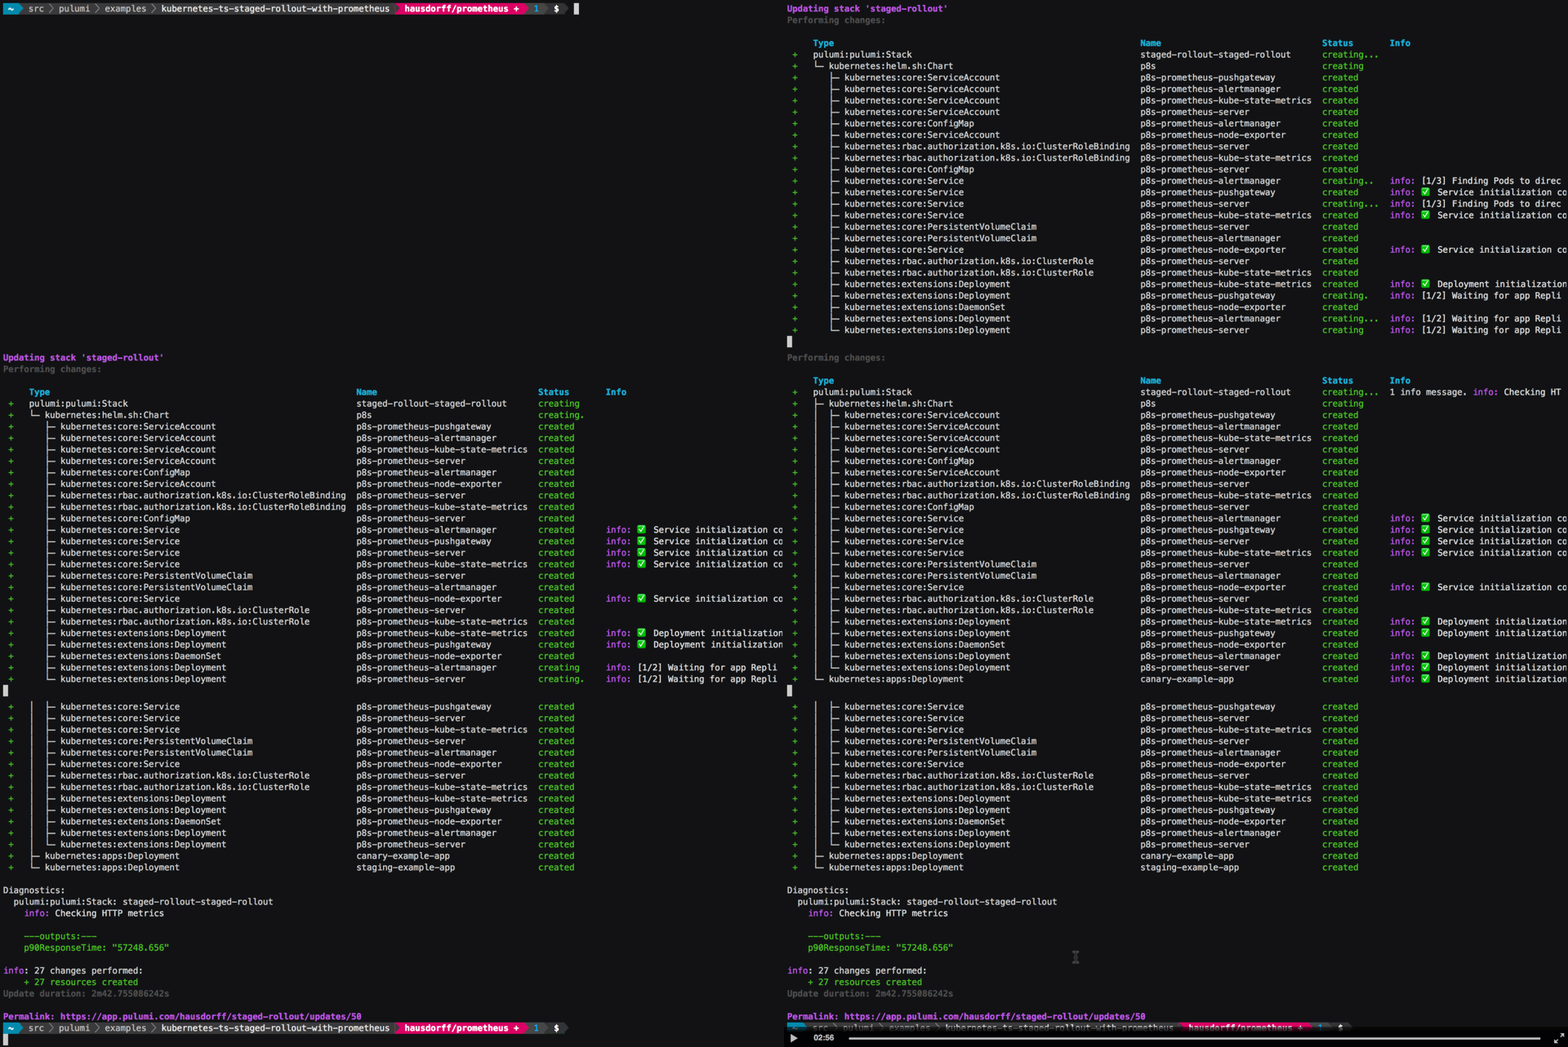
When the program is run, it will look something like the following (although this is sped up by 8x).
The majority of the time is taken up by deploying Prometheus. Towards the end, at the bottom, you
can see canary-example-app and canary-staging-app created.
Prerequisites#
Deploying the example#
-
Install dependencies:
Terminal window npm install -
Create a new stack:
Terminal window pulumi stack init staged-rollout -
IMPORTANT NOTE: The code in
index.tsis meant to be run out-of-cluster (e.g., on your local machine). It will thus callkubectl port-forwardon your behalf so that the Prometheus service is forwarded to your local machine, which allows this program to poll for metrics. If you are running Pulumi in-cluster, you can comment out this part of the example. -
Deploy the stack:
Terminal window pulumi upThe update looks something like this:
Updating stack 'staged-rollout'Performing changes:Type Name Status Info+ pulumi:pulumi:Stack prometheus-staged-rollout+ ├─ kubernetes:helm.sh:Chart p8s created+ │ ├─ kubernetes:core:ServiceAccount p8s-prometheus-alertmanager created+ │ ├─ kubernetes:core:ServiceAccount p8s-prometheus-pushgateway created+ │ ├─ kubernetes:core:ServiceAccount p8s-prometheus-kube-state-metrics created+ │ ├─ kubernetes:core:ServiceAccount p8s-prometheus-server created+ │ ├─ kubernetes:core:ServiceAccount p8s-prometheus-node-exporter created+ │ ├─ kubernetes:core:ConfigMap p8s-prometheus-alertmanager created+ │ ├─ kubernetes:rbac.authorization.k8s.io:ClusterRoleBinding p8s-prometheus-server created+ │ ├─ kubernetes:core:PersistentVolumeClaim p8s-prometheus-server created+ │ ├─ kubernetes:rbac.authorization.k8s.io:ClusterRoleBinding p8s-prometheus-kube-state-metrics created+ │ ├─ kubernetes:core:ConfigMap p8s-prometheus-server created+ │ ├─ kubernetes:core:PersistentVolumeClaim p8s-prometheus-alertmanager created+ │ ├─ kubernetes:core:Service p8s-prometheus-alertmanager created+ │ ├─ kubernetes:core:Service p8s-prometheus-kube-state-metrics created+ │ ├─ kubernetes:core:Service p8s-prometheus-pushgateway created+ │ ├─ kubernetes:core:Service p8s-prometheus-node-exporter created+ │ ├─ kubernetes:extensions:Deployment p8s-prometheus-kube-state-metrics created+ │ ├─ kubernetes:core:Service p8s-prometheus-server created+ │ ├─ kubernetes:extensions:Deployment p8s-prometheus-pushgateway created+ │ ├─ kubernetes:rbac.authorization.k8s.io:ClusterRole p8s-prometheus-kube-state-metrics created+ │ ├─ kubernetes:extensions:DaemonSet p8s-prometheus-node-exporter created+ │ ├─ kubernetes:extensions:Deployment p8s-prometheus-alertmanager created+ │ ├─ kubernetes:extensions:Deployment p8s-prometheus-server created+ │ └─ kubernetes:rbac.authorization.k8s.io:ClusterRole p8s-prometheus-server created+ ├─ kubernetes:apps:Deployment canary-example-app created+ └─ kubernetes:apps:Deployment staging-example-app createdDiagnostics:pulumi:pulumi:Stack: prometheus-test-p8sinfo: Checking HTTP metrics---outputs:---+ p90ResponseTime: "8221.236"info: 2 changes performed:+ 2 resources created26 resources unchangedUpdate duration: 7.362744393sPermalink: https://app.pulumi.com/hausdorff/test-p8s/updates/1One useful sidenote, we can see here in the
---outputs:---section that thep90ResponseTimethat was computed by the promise isexported, which causes Pulumi to report its value just before it terminates.
Cleaning up#
Once you’re finished experimenting, destroy your stack and remove it to avoid incurring any additional cost:
pulumi destroypulumi stack rm