Kubespy, and the lifecycle of a Pod, in 4 images
This post is the first part in a series on the Kubernetes API. Future installments include Part 2 focused on the lifecycle of a
Serviceand Part 3 details how Kubernetes deployments work.
One of the most popular features of the recent v0.15.2 release of Pulumi is fine-grained status updates for Kubernetes resources. On the CLI they look like this:
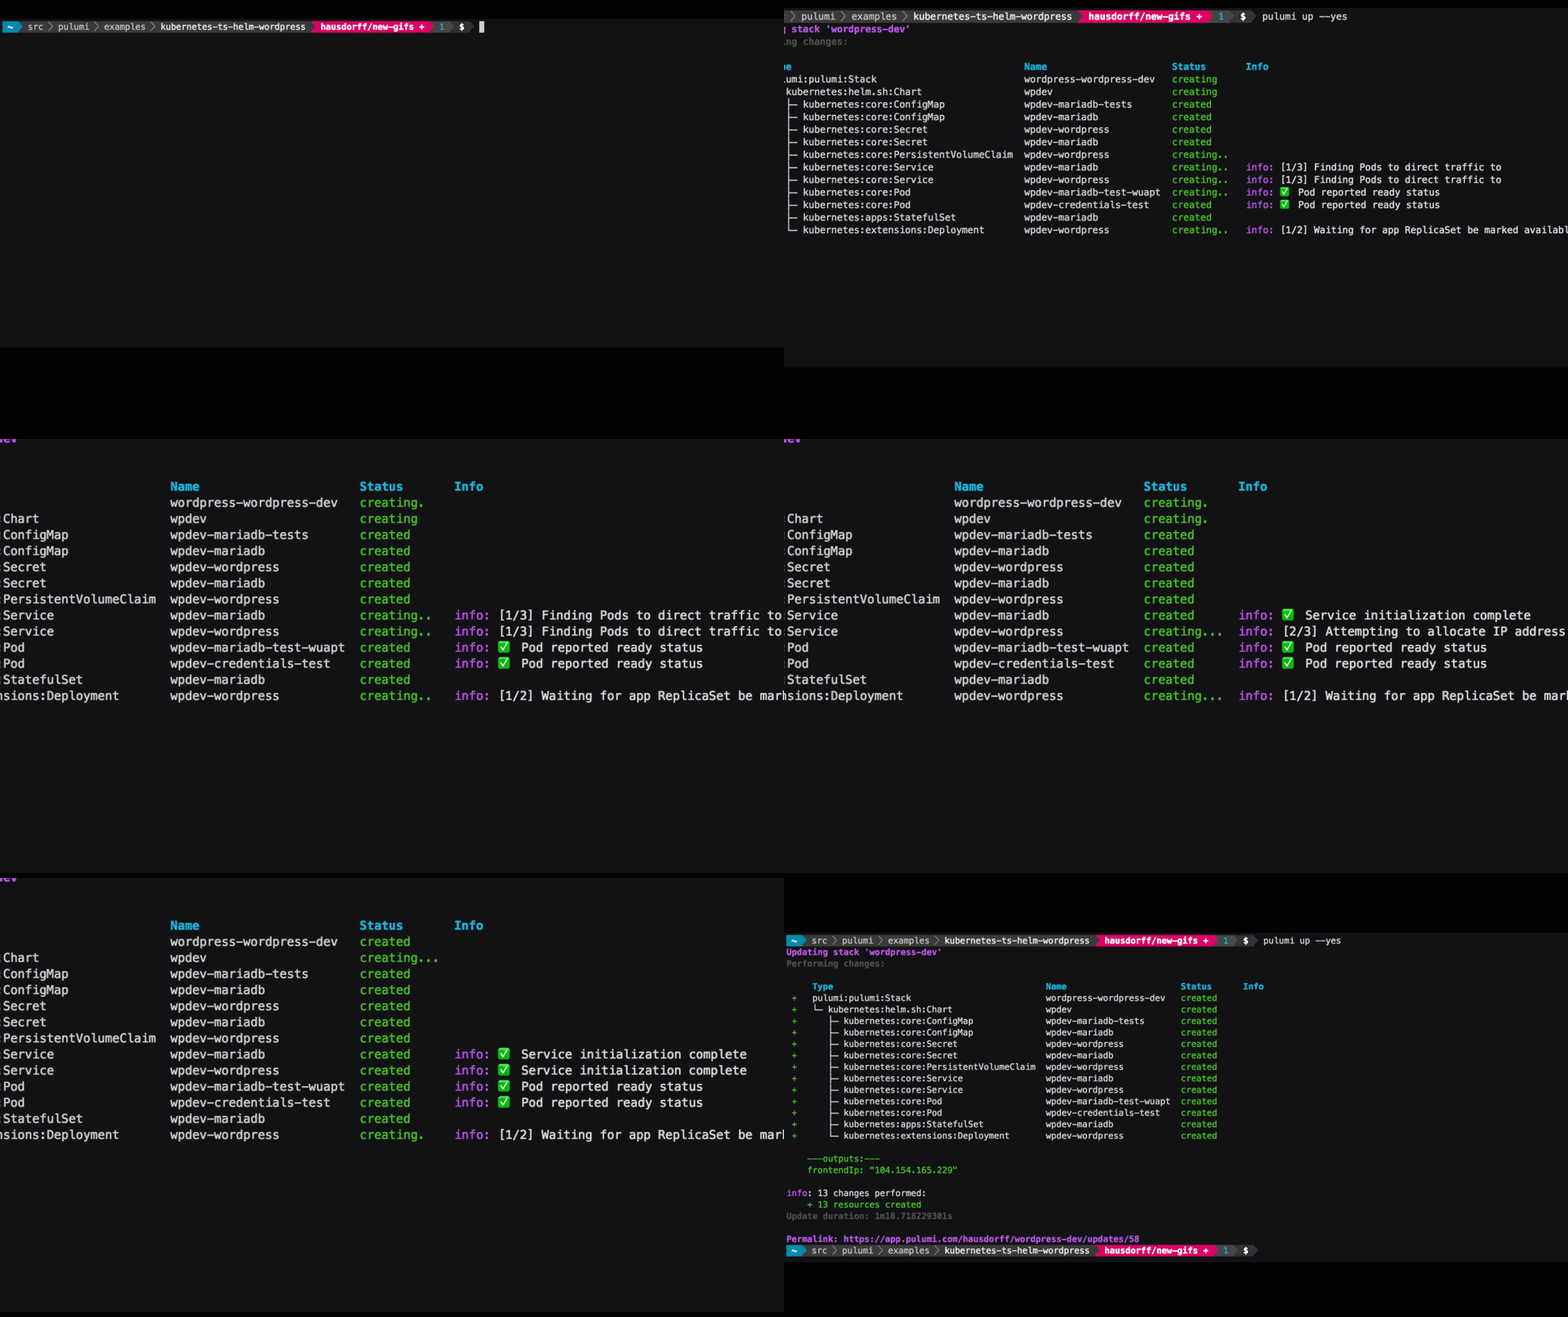
But wait — how does this work exactly? What is actually happening
when you deploy a Pod to a cluster? How does a Service go from
uninitialized, to being allocated a public IP address? How often is my
Deployment’s status changing?
To answer these questions and others like them, today we’re releasing
a small tool, kubespy,
purpose-built to help you answer questions like this, by displaying the
changes made to a Kubernetes object in real time. For example, in the
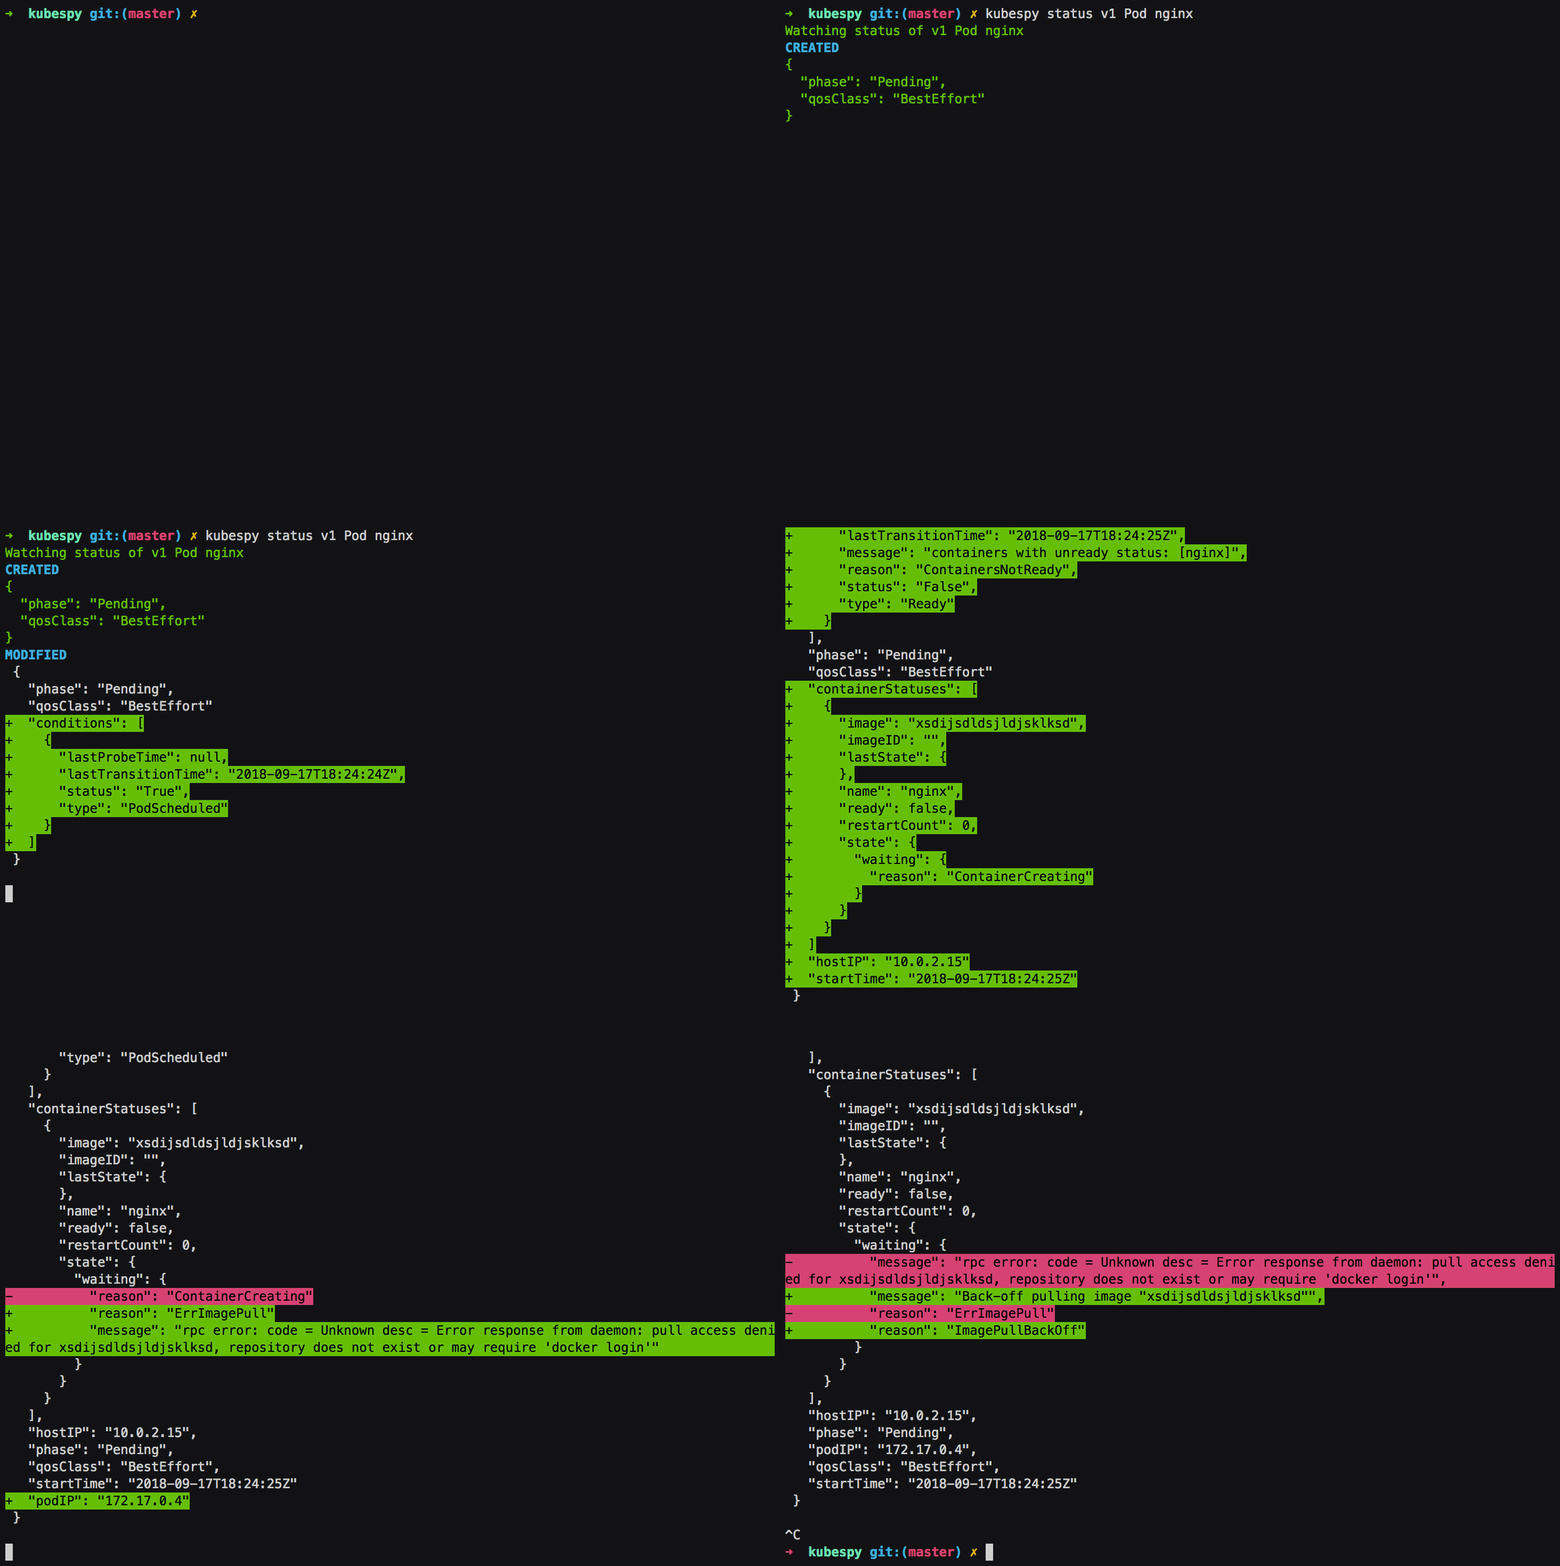
following gif, we’re running kubespy status v1 Pod nginx to watch the
changes to a Pod’s status as it is booted up.
We will spend the rest of this short post using kubespy to take a
closer look at what happens to a Pod when it’s deployed to the
cluster.
What happens when you boot up a Pod?
kubespy comes with a simple example
that deploys nginx using a naked Pod. (The example works with both the
Pulumi CLI and kubectl, but we hope you’ll give Pulumi a shot!)
The essential gist is that kubespy will sit and watch for the example
Pod to be created or changed; once you deploy the Pod (either
pulumi up or kubectl apply), you will see something like the gif
above.
If you do this yourself, you will see that there are 4 updates reported
by kubespy, each of which individually gives us a fairly clear picture
of what Kubernetes is doing internally to try to run the Pod:
First: Acknowledging the Pod definition is written to etcd.
The API server receives the Pod definition and begins trying to schedule it.

Second: Scheduling the Pod.
The scheduler successfully schedules the Pod to run on a node.
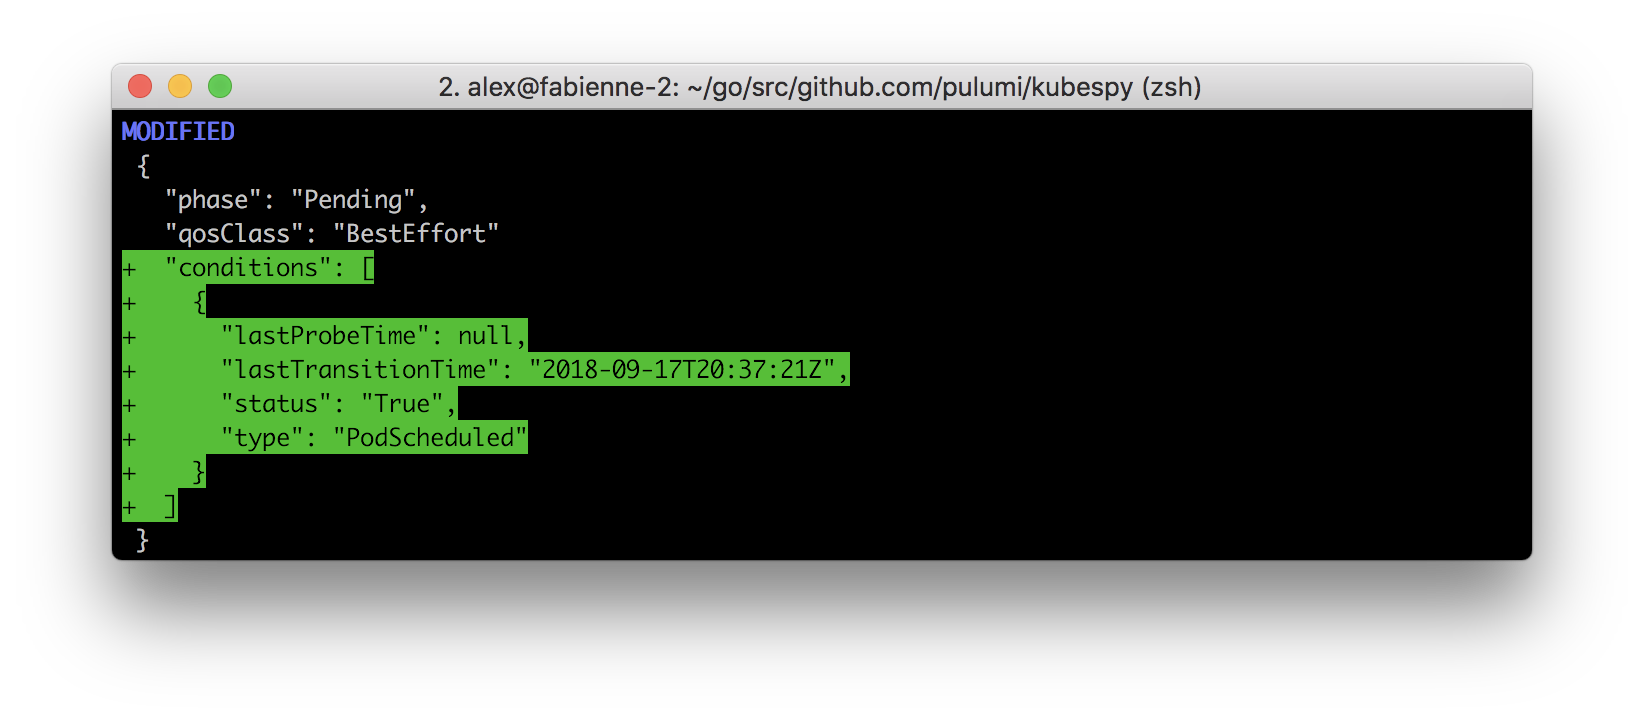
Third: Creating the Pod.
The kubelet running on the node receives the Pod definition and begins “creating”
the Pod. This involves pulling the
container image, adding volume mounts, etc. At the end of all of this,
it will attempt to run the container.
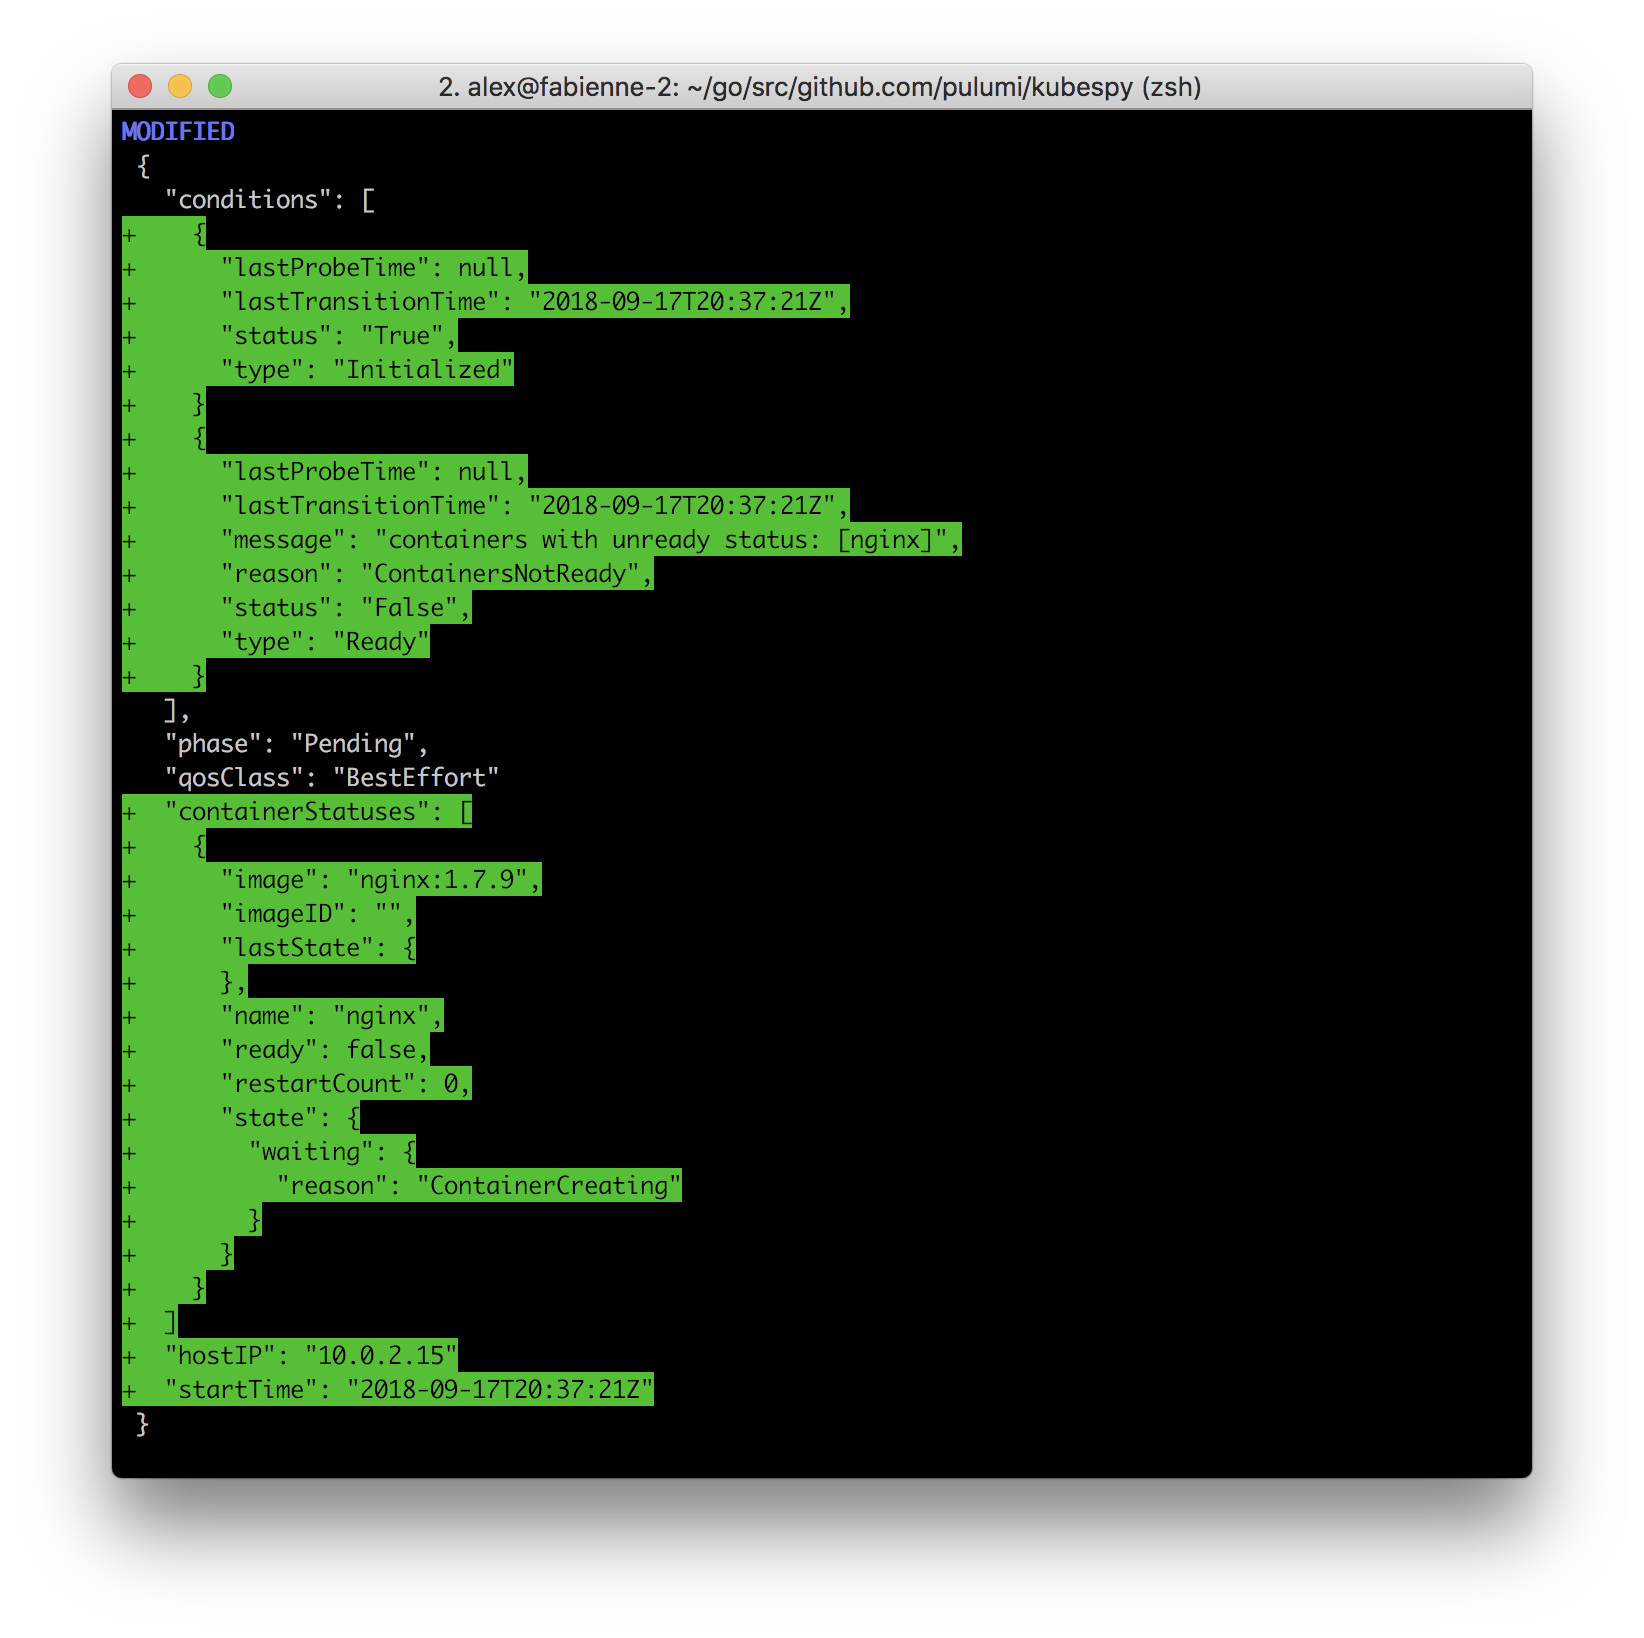
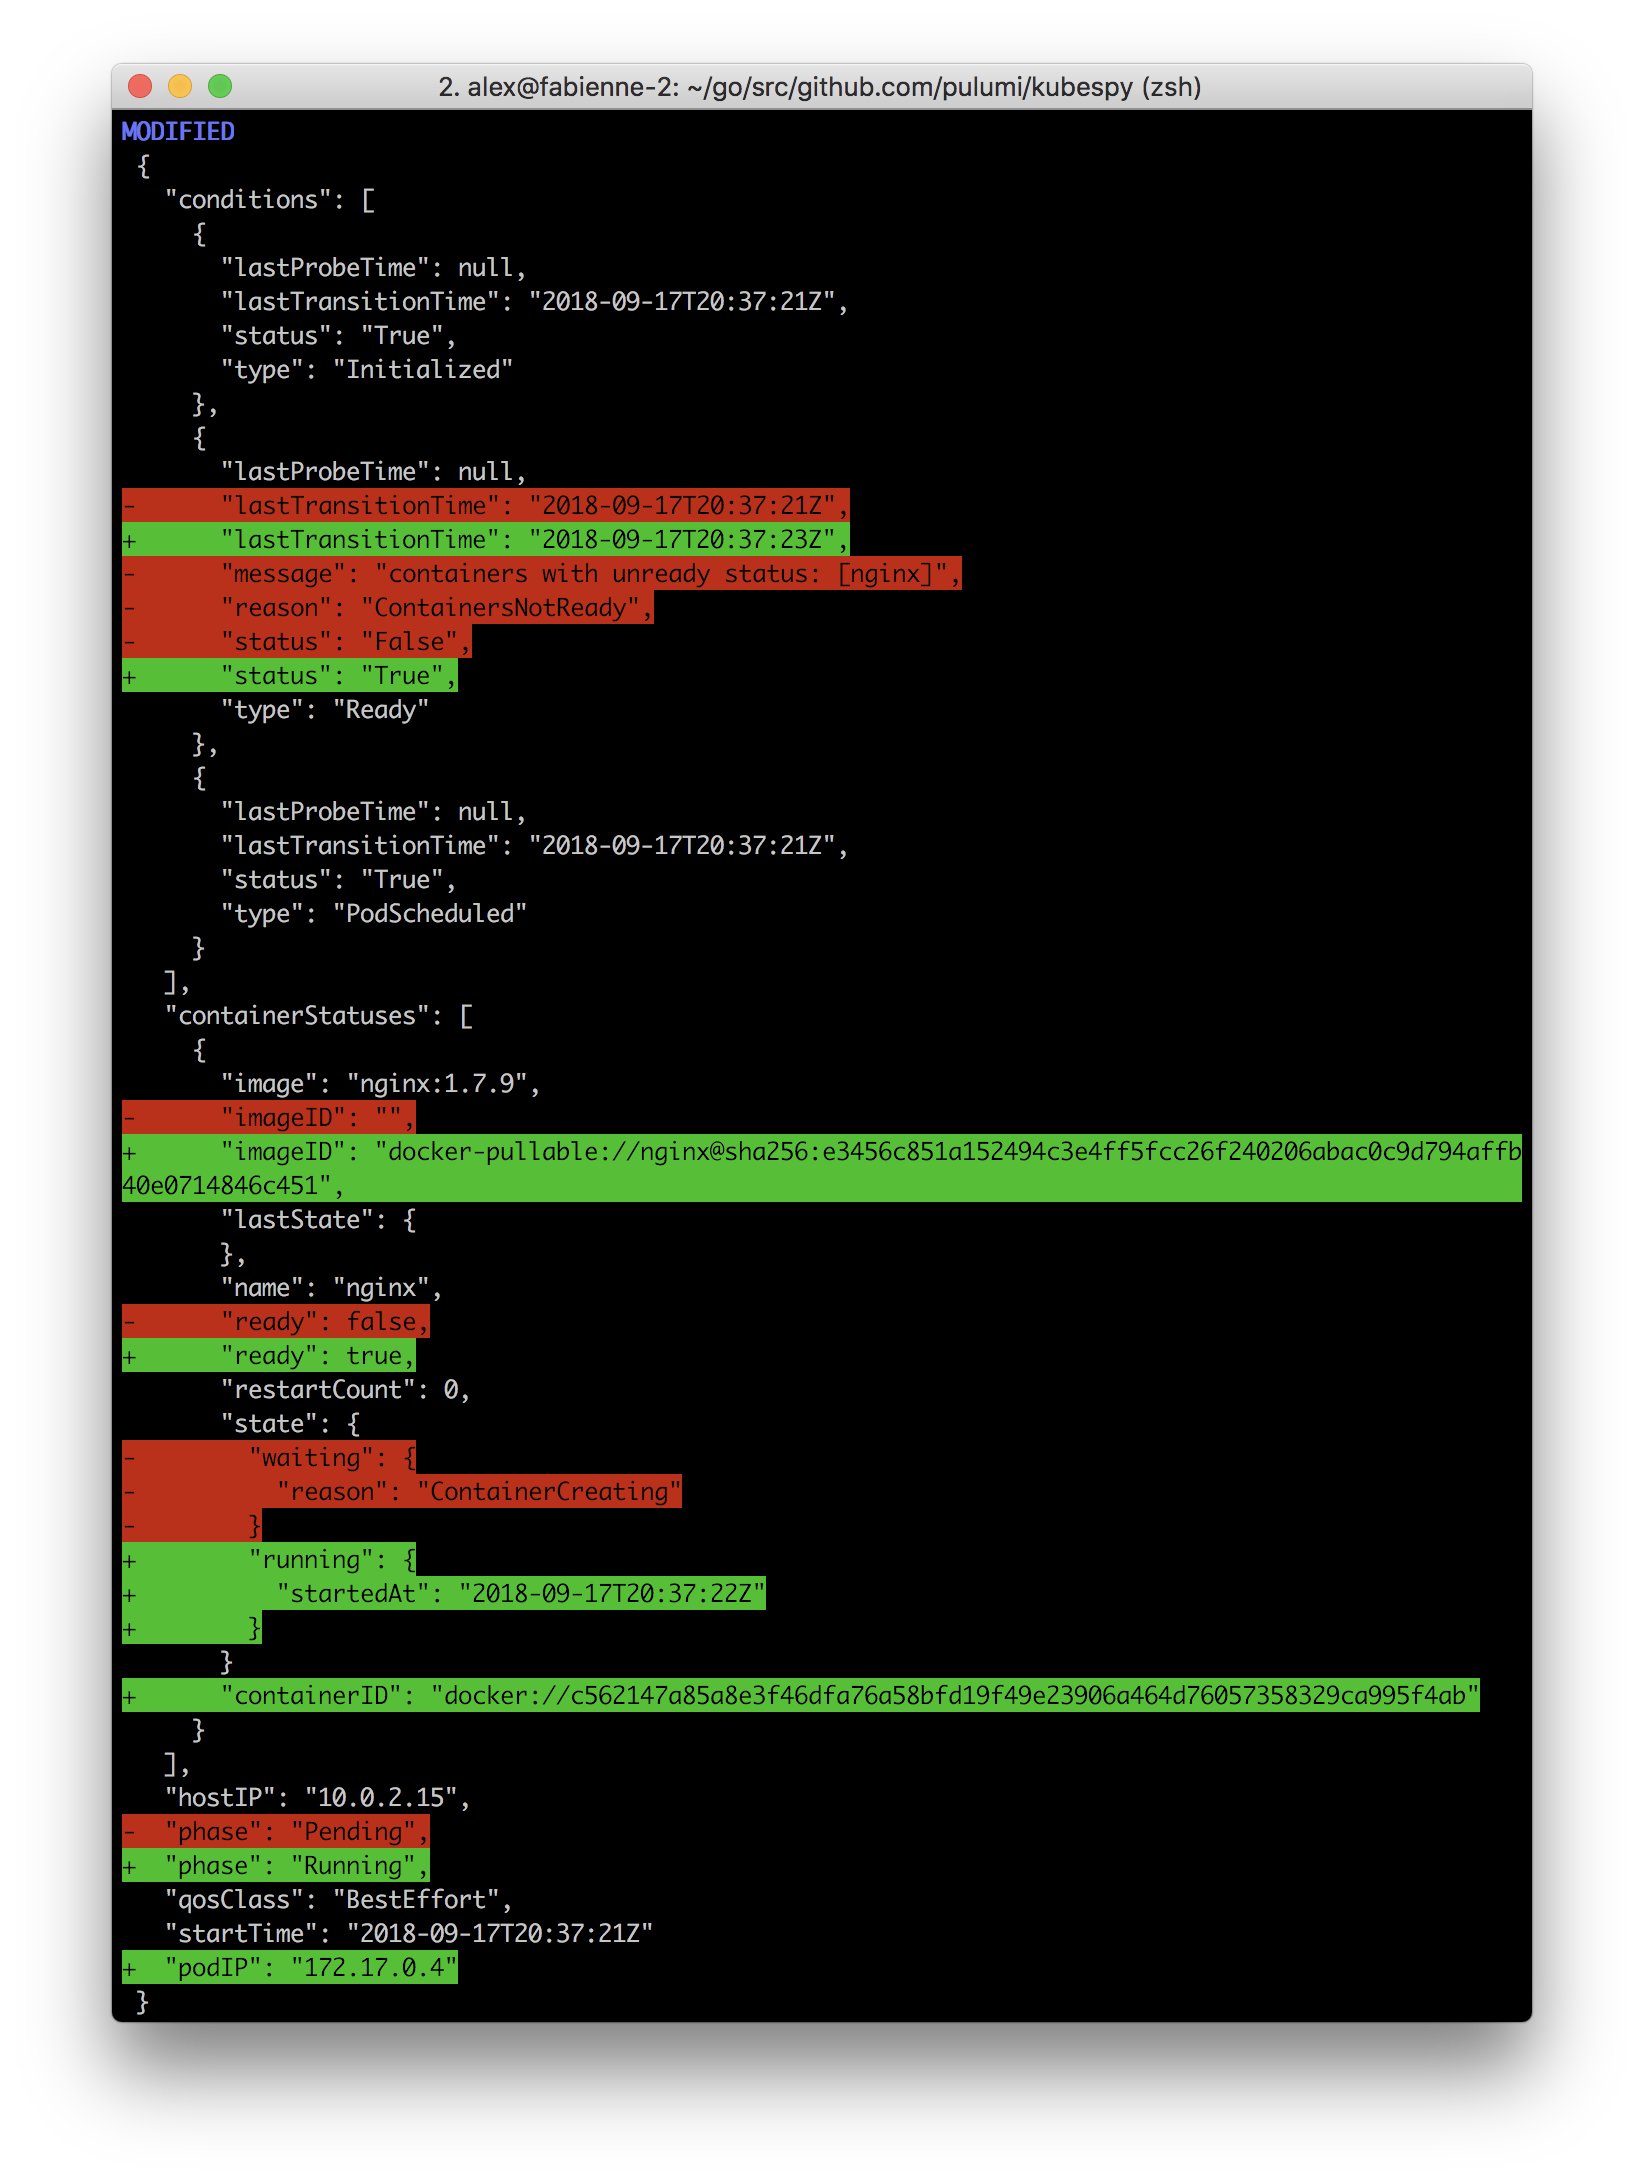
Fourth: Marking the Pod as Running.
The kubelet has now resolved the image
tag to a specific SHA, pulled it to the node, has successfully applied
the required configuration, and has successfully started the nginx
container. In this case, the Pod contains only one container to run,
and once it’s initialized, the whole Pod gets marked running.
Exercises:
- Try inducing an error and see what
kubespyoutputs! Make the image tag nonsense, add a volume that doesn’t exist, and so on. - Try booting up a service! See what
kubespydisplays under various configurations!
Conclusions, and the subtleties of the Pod API.
This post shows a fairly basic, happy-path use of Pods, and shows that
we can kubespy status to see exactly what our containers are up to.
But wait — what does Running mean, precisely? If a Pod is
Running, does that mean it’s healthy? If a Pod has multiple
containers, and one crashes, does it still get marked Running? Are
there any other settings that can change when a Pod is marked
Running?
Unfortunately, though the Pod is the atomic compute abstraction of
Kubernetes (or perhaps because of this), the answer to these questions
turns out to be fairly subtle. But, because Pods are so important, we
should endeavor to answer them anyway!
In the next post, we will kubespy to observe some of the subtleties of
the Pod lifecycle, and especially the effect of restartPolicy on the
semantics of the Pod object. We will also talk about some of the best
practices we’ve accumulated, and describe how we solved the problem of
repeatable Pod deployments in Pulumi.
If you enjoyed this post, or are curious to see how this lifecycle is baked into the Pulumi CLI, give us a shot! We’d love to have your feedback.
