kubespy trace: a real-time view into the heart of a Kubernetes Service
This post is part 3 in a series on the Kubernetes API. Earlier, Part 1 focused on the lifecycle of a
Pod, and later Part 3 details how Kubernetes deployments work.
Why isn’t my Pod getting any traffic?
An experienced ops team running on GKE might assemble the following checklist to help answer this question:
- Does a
Serviceexist? Does that service have a.spec.selectorthat matches some number ofPods? - Are the
Pods alive and has their readiness probe passed? - Did the
Servicecreate anEndpointsobject that specifies one or morePods to direct traffic to? - Is the
Servicereachable via DNS? When youkubectl ``execinto aPodand you usecurlto poke theServicehostname, do you get a response? (If not, does anyServicehave a DNS entry?) - Is the
Servicereachable via IP? When you SSH into aNodeand you usecurlto poke theServiceIP, do you get a response? - Is
kube-proxyup? Is it writing iptables rules? Is it proxying to theService?
This question might have the highest complexity-to-sentence-length ratio of any question in the Kubernetes ecosystem. Unfortunately, it’s also a question that every user finds themselves asking at some point. And when they do, it usually means their app is down.
To help answer questions like this, we’ve been developing a small
diagnostic tool, kubespy. In this post we’ll look at the new
kubespy trace command, which is broadly aimed at automating questions
1, 2, 3, and providing “hints” about 4 and 5.
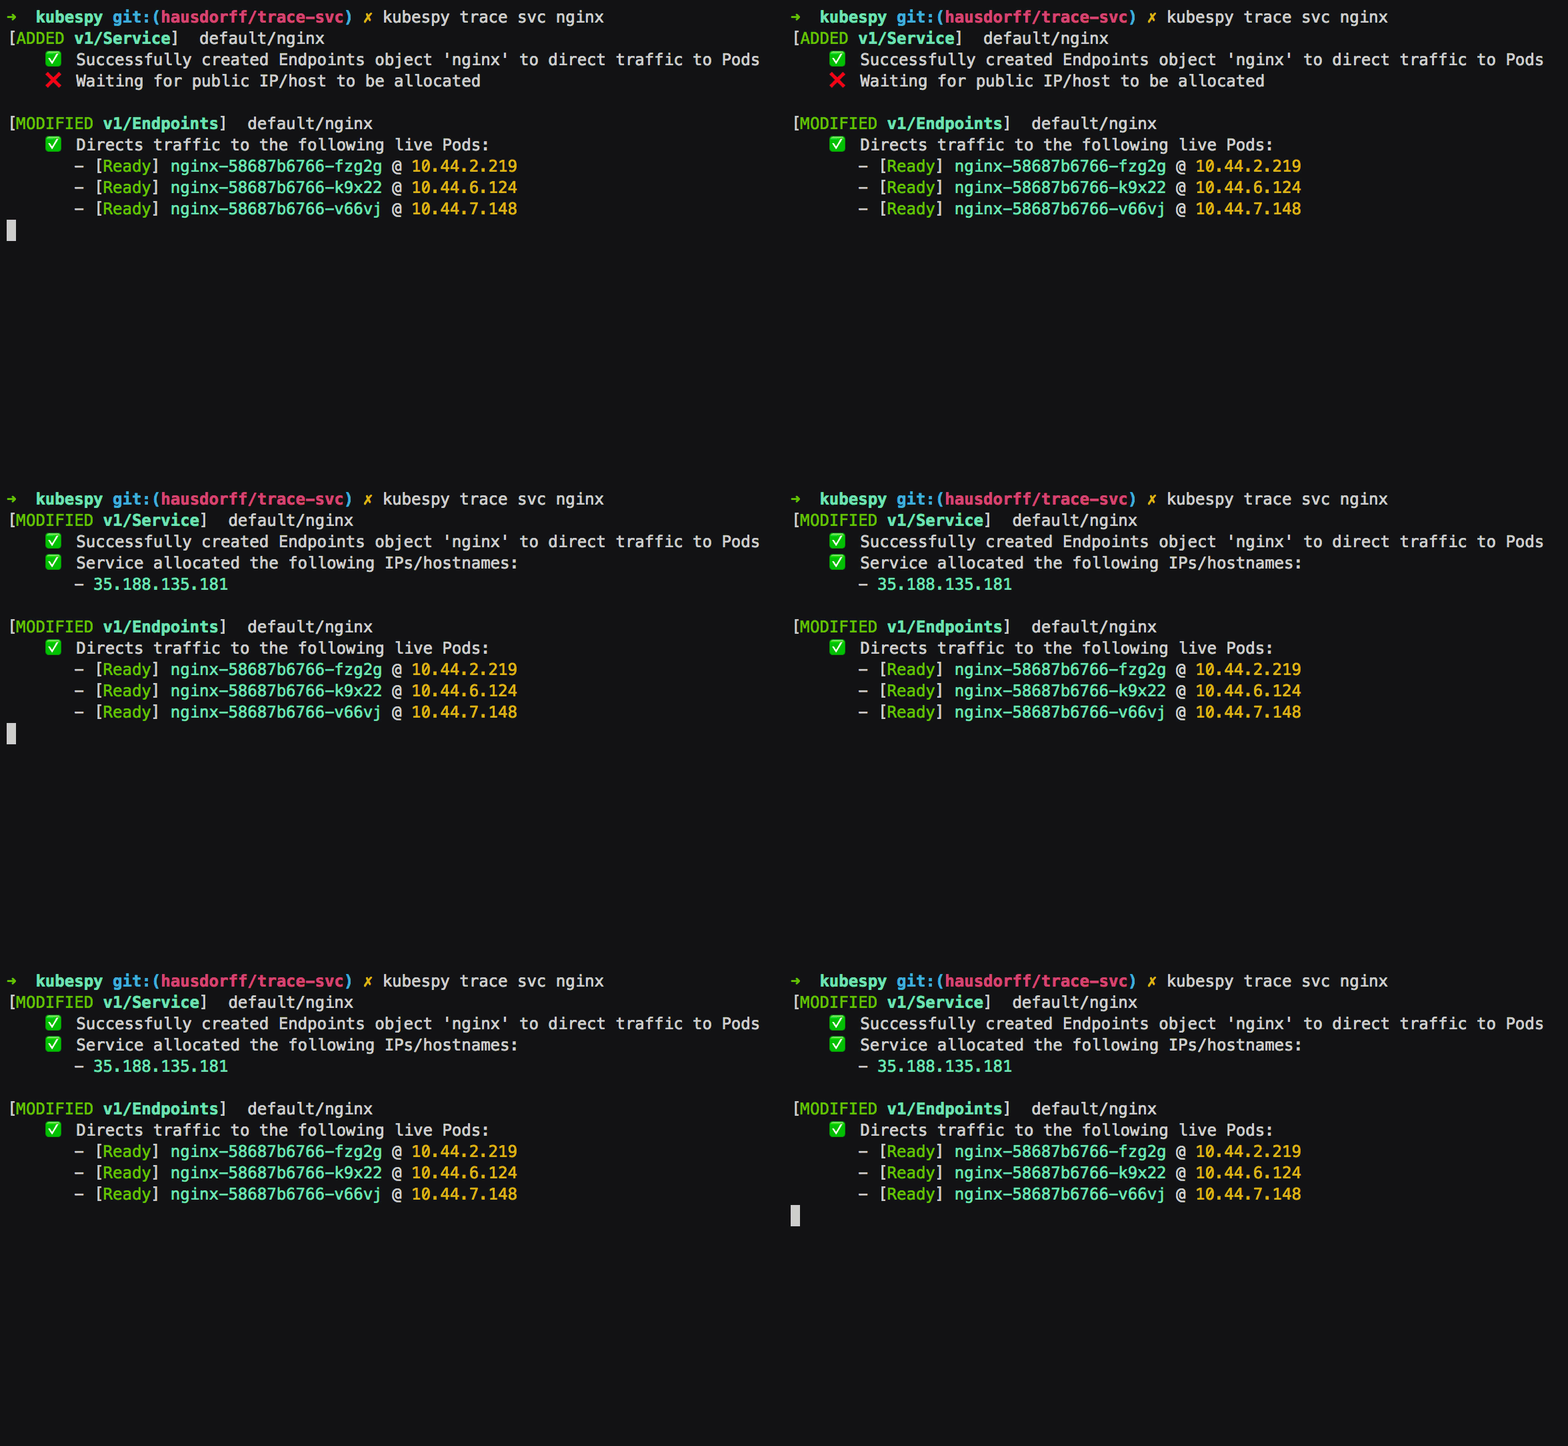
Below is a gif demonstrating the CLI experience. You can watch in
real-time as the Service comes online, finds pods to target, and
finally is allocated a public IP address:
What is kubespy, again?
kubespy is a simple, standalone diagnostic tool, meant to make it easy
to introspect on Kubernetes resources in real time.
Before we begin, it’s worth noting that this kubespy actually
re-packages the machinery we developed for Kubernetes support in
Pulumi.
One of our major goals in this work was to make deploying an application to Kubernetes as simple as possible, by presenting a concise summary of this information in the CLI experience. See my tweetstorm on the subject, or try it out for yourself!

A real-time view of a Service’s life
The kubespy repository contains
the simple trace example
we use in this demo. The
README
contains detailed installation instructions, as well as explaining how
to run the app (using either kubetl or pulumi though of course we
hope you will try Pulumi).
Essentially: running kubespy trace service nginx will cause kubespy
to sit and wait for you to deploy a Service called nginx. When you
run this example, it will do just this: creating a Deployment which
replicates an nginx Pod 3 times and exposes it publicly to the
Internet with a Service, also called nginx.
Let’s break down the kubespy trace gif above to show that there are
actually several distinct steps in the process of booting up a
Service.
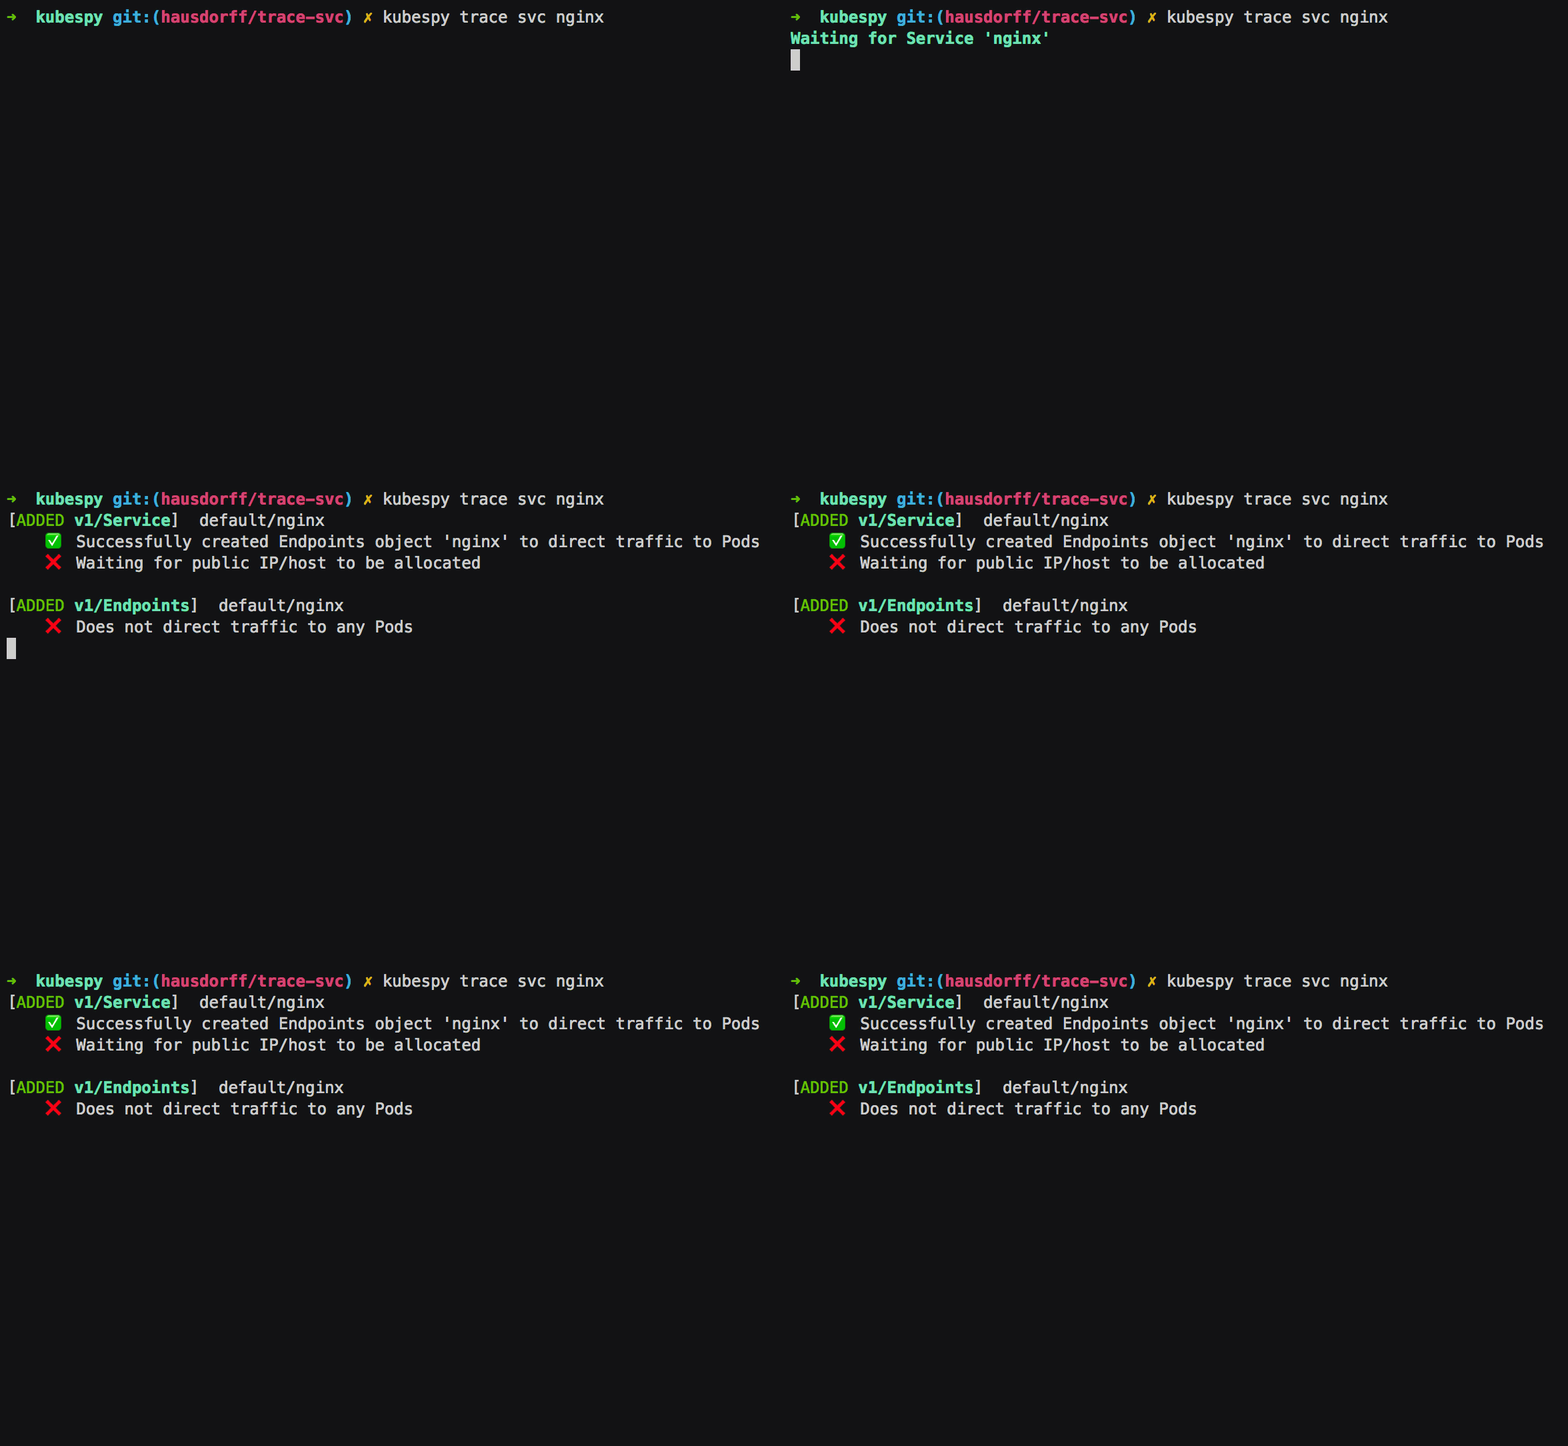
First: Service is created, the Service controller creates an
Endpoints object of the same name. The Endpoints object is to
specify which Pods get traffic — their IPs, which ports to direct
traffic to, and so on. In this case, there are no Pods to target,
which kubespy trace tells us:
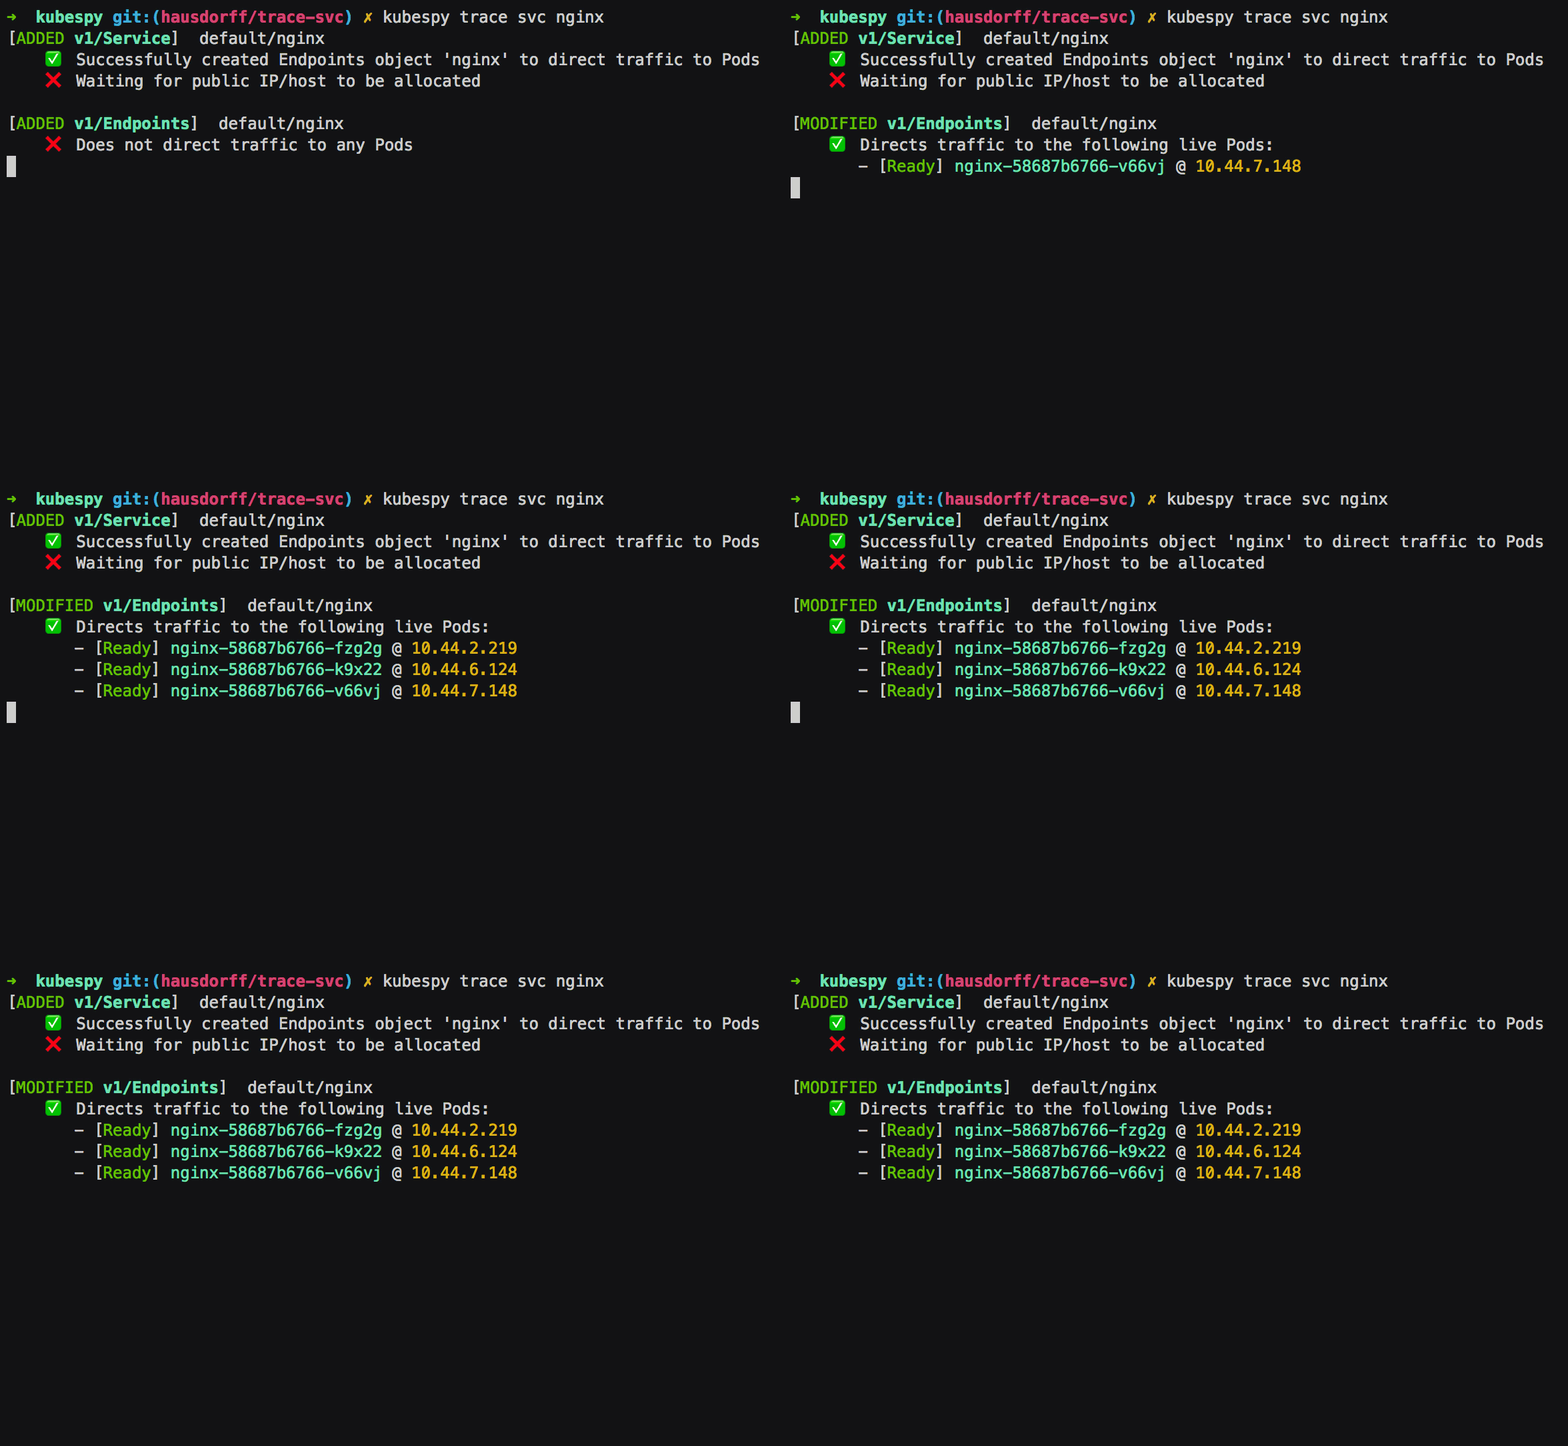
Second: Pods that match the Service’s .spec.selector are
created; their readiness probes immediately pass. The Endpoints
object is updated to reflect this. As we will see below, if the Pods
failed the readiness probes, kubespy trace would note this.
Third: Service is allocated a public IP address. The Service has
.spec.type set to LoadBalancer, which on most cloud platforms means
that a public IP address should be allocated for it.

Exercise: Other Service types, watching rollouts, deleting Services!
kubespy trace supports all the other Service types, including
ExternalName and ClusterIP. Try both of those, and you’ll see
slightly different output. Try them! It’s also worth watching what
happens when a Service is deleted.
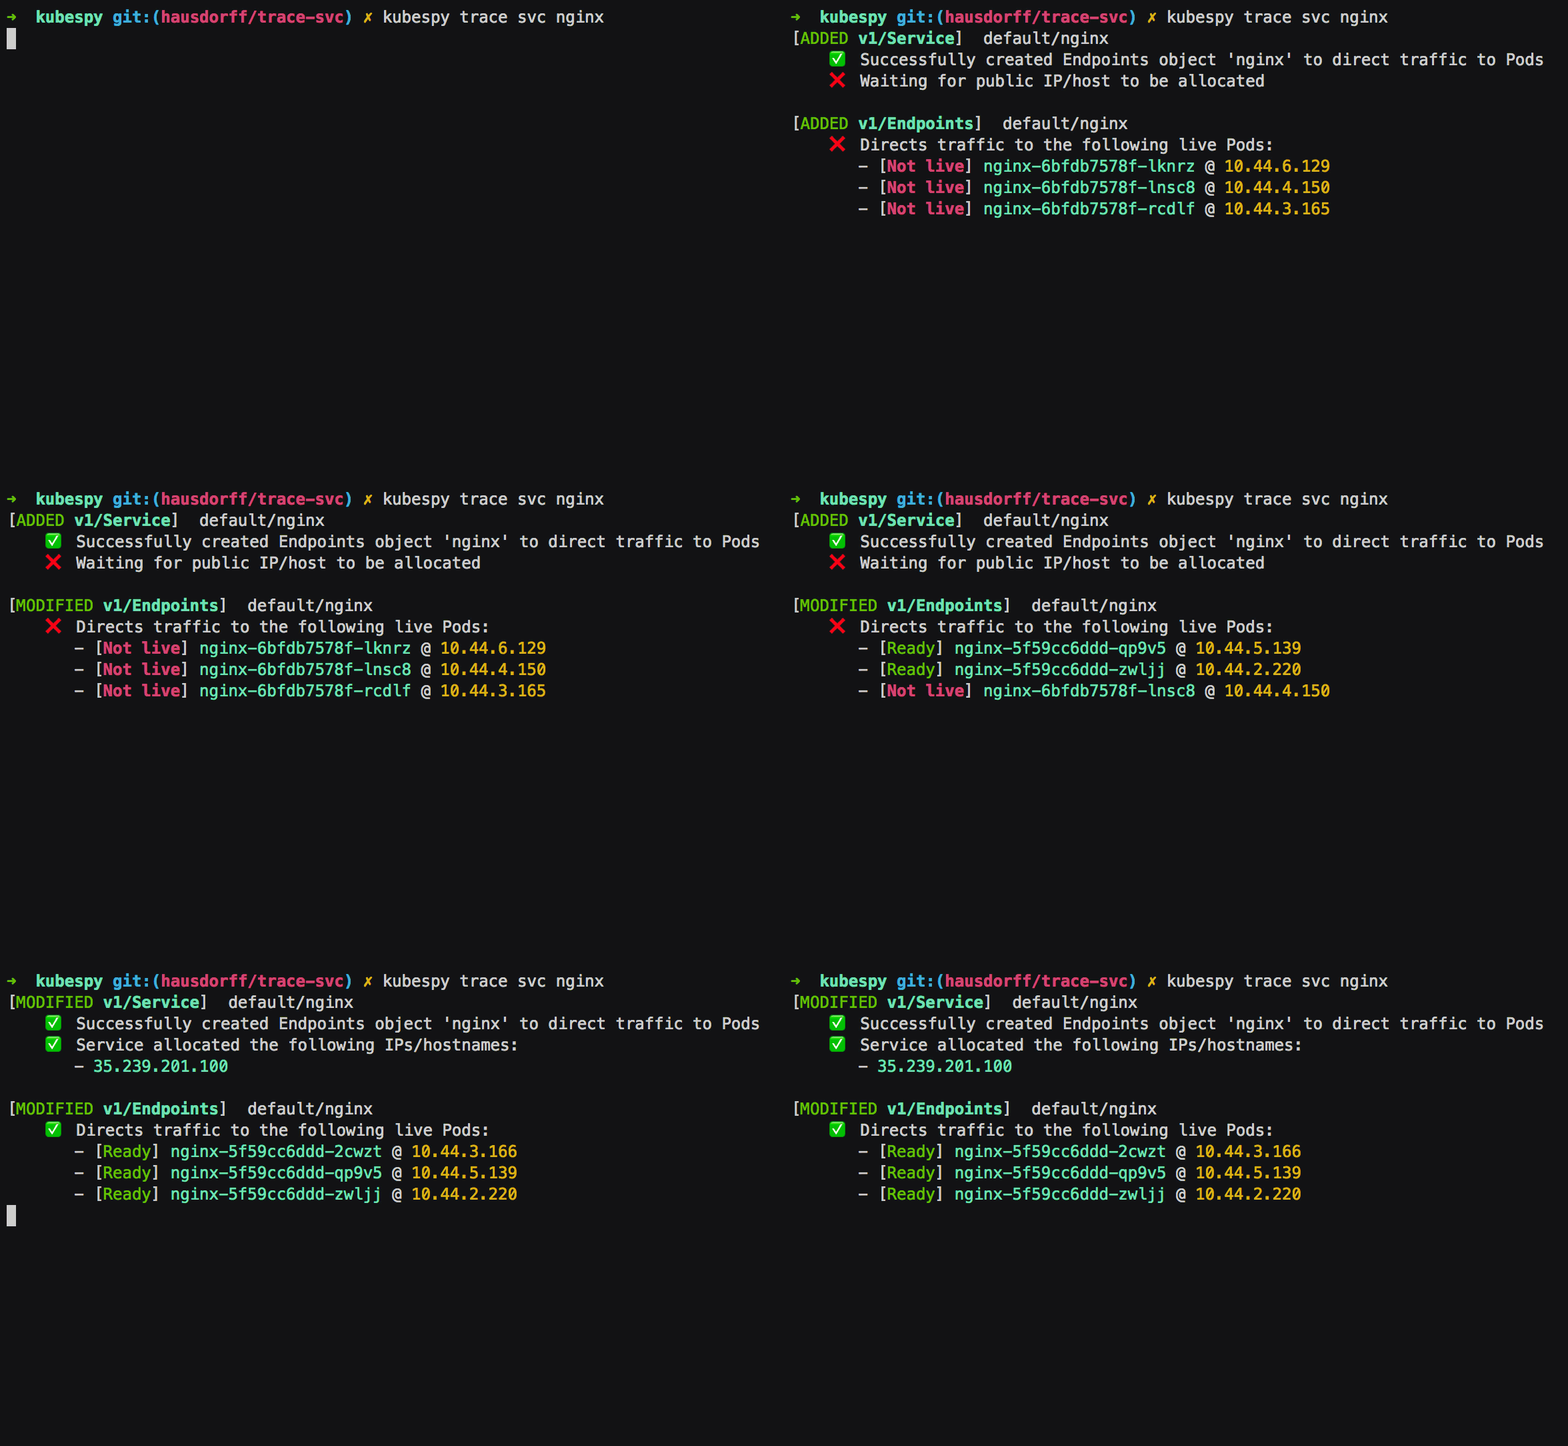
You can also use kubespy trace to watch an unhealthy deployment become
healthy. In the following gif, we see a bunch of Pods that are failing
readiness checks become healthy as a new version is rolled out:
Conclusions
Confession time. Last time we told you we’d dig more into the lifecycle
of a Pod. And we will, at some point. But we ended up deciding that it
would be easier to explain with a cohesive trace command.
And, while this is a good start, it is only the beginning. trace
currently supports only Service. In our next post, we’ll extend trace
to Deployment (or perhaps ReplicaSet), and from there, we will have
enough tools to really dig into what is happening when you roll out your
app.
In the mean time, if you enjoyed this post, or are curious to see how this lifecycle is baked into the Pulumi CLI, give it a spin! We’d love to have your feedback.
