
Pulumi community member Kay Plößer spent some time digging into setting up observability of a Pulumi deployment using Honeycomb. Read more to find out all the details on configuring Honeycomb and Pulumi together, with a side dish of Automation API!
Last few weeks, I procrastinated doing real product-related things with setting up monitoring for my infrastructure deployment.
I’m using @pulumidev, a cloud-provider independent IaC framework that allows me to define my infrastructure in TypeScript and use whatever provider I need.
I read something about Honeycomb’s observability approach to monitoring, and it got me thinking about my deployment code. Later, it will probably run with something like GitHub Actions, so it’s not on my machine when it executes. This means I need some insights in case things go wrong. But it would also be good to see how the deployment behaves over time. How do new resources affect deployment durations etc.?
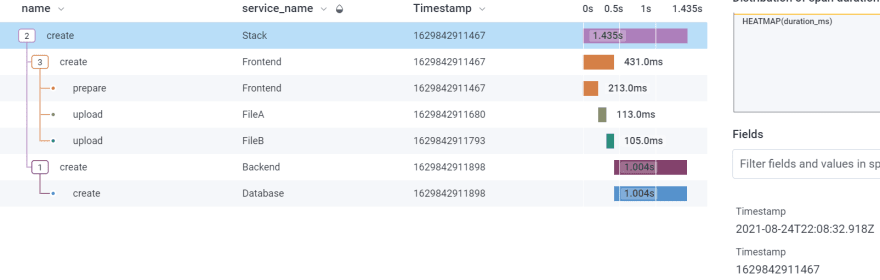
This is what a trace could look like in Honeycomb:
Why not setting things up before I move deployment from my development machine to the cloud?
This article will show you how to make your Pulumi deployment observable with @honeycomb_io
Prerequisites
- Node.js
- A Pulumi account
- The Pulumi CLI
- A Pulumi stack
- A Honeycomb account
The Pulumi Automation-API
This API is a programmatical interface to the Pulumi CLI. Think Puppeteer for Pulumi instead of Chrome.
Since it controls the CLI, it can do everything the CLI can and more.
For our use case, we need information about which resource is deployed to tell Honeycomb about it, and it will create nice trace graphs for us.
To run a pulumi up command with the automation API, we need the following code:
const { LocalWorkspace } = require("@pulumi/pulumi/automation")

const main = async () => {
  const stack = await LocalWorkspace.createOrSelectStack({
    stackName: "development",
    workDir: ".",
  })
  await stack.up()
}

main()
The @pulumi/pulumi package already includes the automation API, so it’s the only one we need.
We use the LocalWorkspace object to load our stack. This leaves the wholes stack intact; we can still deploy/destroy it with the CLI.
Then we call stack.up() and wait. The outputs generated from the API aren’t as pretty as the ones from the CLI, but they contain the same information.
Also, the up command of the API allows us to catch all events that are happening during the deployment. This is the data we’re after.
The Deployment Events
The up method of the stack object takes a config object. We can use the onEvent attribute to listen to all the changes.
stack.up({
  onEvent: (event) => {
    console.log(event)
  },
})
Here we log out every event. If we look at the output, we notice there are different types of events.
-The preludeEvent fires at the start with information about the stack config.
-The resourcePreEvent fires before a resource is deployed, and the resOutputsEvent fires after it has been deployed.
-The diagnosticEvent contains eventual errors that could happen.
-The summaryEvent includes info about what has been done and if e everything was successful.
The event structure is a bit strange. The events don’t have a type attribute we could switch over, but an attribute called like the type of the event.
The following code shows how to get the right event, and where the data hides in that event:
onEvent: (event) => {
  if (event["preludeEvent"] !== undefined)
    return console.log(event.preludeEvent.config)

  if (event["resourcePreEvent"] !== undefined)
    return console.log(event.resourcePreEvent.metadata)

  if (event["resOutputsEvent"] !== undefined)
    return console.log(event.resOutputsEvent.metadata)

  if (event["diagnosticEvent"] !== undefined)
    return console.log(event.diagnosticEvent)

  if (event["summaryEvent"] !== undefined)
    return console.log(event.summaryEvent)
},
If we run things like this, we get all the information we need to send to Honeycomb. The next step is to tell Honeycomb what’s up.
Sending Data to Honeycomb
Honeycomb provides us with two libraries. The Node.js Beeline and Libhoney.
Libhoney is a low-level Honeycomb client that allows sending raw events to their service API. The Beeline is an abstraction on top of Libhoney to help with instrumentation and traces.
Usually, it would be best if you used the Beeline because it’s easy to set up and works with Node.js’s internal HTTP module and the Express framework out of the box.
In this case, we aren’t building an HTTP server, so the Beelines instrumentation doesn’t help much.
So for our deployment example, I will stick to Libhoney.
Honeycomb Events & Traces
Honeycomb uses events to figure out what’s happening in your system. Suppose the events have special attributes, like trace.trace_id and trace.span_id, Honeycomb can correlate them. This way, it can tell you things like, “The trace for your request took 300ms and consisted of 100ms authentication and 200ms database access.”
So you can pump all your information to Honeycomb via events. Sometimes it doesn’t need to be correlated; you only want to tell Honeycomb that your server uses 20% of memory. But in our case, we want to tie up all events related to one deployment into a trace, so we can figure out what we deploy, how long it takes, and if something goes wrong, what resource was responsible.
Linking up Pulumi & Honeycomb
We need to initialize Libhoney and send the correct “Honeycomb event” for every “Pulumi event.”
But let’s start with getting one event into Honeycomb: the pulumi up event.
const Libhoney = require("libhoney")
const { LocalWorkspace } = require("@pulumi/pulumi/automation")

const hny = new Libhoney({
  writeKey: "<HONEYCOMB_API_KEY>",
  dataset: "example-iac",
})

const id = (name) => `${name}-${Date.now()}`

const traceId = id`trace`
const rootSpanId = id`trace-root-span`
const startTimestamp = Date.now()

const main = async () => {
  const stack = await LocalWorkspace.createOrSelectStack({
    stackName: "development",
    workDir: ".",
  })
  await stack.up({
    onEvent: (event) => {},
  })
}

main().then(() => {
  hny.sendNow({
    name: "up",
    service_name: "Pulumi",
    "trace.trace_id": traceId,
    "trace.span_id": rootSpanId,
    duration_ms: Date.now() - startTimestamp,
  })
})
We define a traceId, a rootSpanId, and a startTimestamp at the beginning, and then we send it off when everything is done.
An event with trace.trace_id will be grouped up with all other events with the same trace ID. In this case, we only have one event.
The name is usually the action you perform and want to measure, and the service_name is, well, the service that performs this action. In this case, we run pulumi up.
In the end, we also send a duration_ms attribute to track how long things take.
The result will look like this:
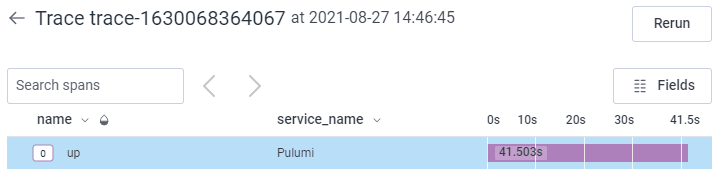
Not very interesting, but at least we know it run without crashing and how long it took.
Getting More Details
The next step is to get the details. What were the config parameters? How long did different parts of the deployment take?
For this, we need to look into two events, the preludeEvent and the summaryEvent.
Until now, we only send one Honeycomb event for the Pulumi up command.
Now, we will send three events for the stack.
- The
initevent will contain the time it took to get to the actual deployment of resources and the config parameters of the stack - The
runevent will contain the duration all resources took to do their thing. - The
finishevent will contain the duration of shutting down the automation API and the summary data.
Let’s look at the updated example code:
...

const traceId = id`trace`
const rootSpanId = id`trace`
const startTimestamp = Date.now()
let stackFinishStartTimestamp

const main = async () => {
  const initStartTimestamp = Date.now()
  const runStackSpanId = id`stack`
  let stackRunStartTimestamp

  const stack = await LocalWorkspace.createOrSelectStack({
    stackName: "development",
    workDir: ".",
  })
  await stack.up({
    onEvent: (event) => {
      if (event["preludeEvent"] !== undefined) {
        const hnyEvent = hny.newEvent()
        hnyEvent.timestamp = new Date(initStartTimestamp)
        hnyEvent.add({
          name: "init",
          service_name: "Stack",
          "trace.trace_id": traceId,
          "trace.parent_id": rootSpanId,
          "trace.span_id": id`stack`,
          duration_ms: Date.now() - initStartTimestamp,
          ...event.preludeEvent.config,
        })
        hnyEvent.send()
        stackRunStartTimestamp = Date.now()
        return
      }

      if (event["summaryEvent"] !== undefined) {
        const hnyEvent = hny.newEvent()
        hnyEvent.timestamp = new Date(stackRunStartTimestamp)
        hnyEvent.add({
          name: "run",
          service_name: "Stack",
          "trace.trace_id": traceId,
          "trace.parent_id": rootSpanId,
          "trace.span_id": runStackSpanId,
          duration_ms: Date.now() - stackRunStartTimestamp,
        })
        hnyEvent.send()
        stackFinishStartTimestamp = Date.now()
        return
      }
    },
  })
}

main().then(() => {
  let hnyEvent = hny.newEvent()
  hnyEvent.timestamp = new Date(stackFinishStartTimestamp)
  hnyEvent.add({
    name: "finish",
    service_name: "Stack",
    "trace.trace_id": traceId,
    "trace.parent_id": rootSpanId,
    "trace.span_id": id`stack`,
    duration_ms: Date.now() - stackFinishStartTimestamp,
  })
  hnyEvent.send()

  hnyEvent = hny.newEvent()
  hnyEvent.timestamp = new Date(startTimestamp)
  hnyEvent.add({
    name: "up",
    service_name: "Pulumi",
    "trace.trace_id": traceId,
    "trace.span_id": rootSpanId,
    duration_ms: Date.now() - startTimestamp,
  })
  hnyEvent.send()
})
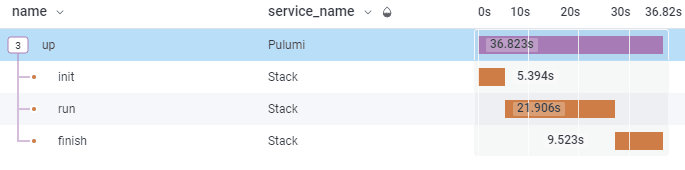
First, we need to sprinkle variables on the code that capture the start times of our three events.
The init event starts before the call to the up command and takes until the preludeEvent is fired by the automation API.
The run event starts right after the init event finishes and takes until the summaryEvent fires.
The finish event starts right after run finishes and stops right before the parent event for Pulumi up is finished.
These events all get the trace.parent_id of the Pulumi up event, so they get nested in the Honeycomb view later.
Also, the init event gets the event.preludeEvent.config object, so we can see how the stack was configured inside Honeycomb.
If we run that example, we should see something like this:
Getting Resource Deployment Durations
The resources have additional details for us. As a name for the event, we will use the operation (create, update, delete) and as service_name we use the name of the resource in the Pulumi definition.
To get the parent of a resource, we have to save the URNs of every resource for later. But since we have to keep the start times anyway, we can do this in one step when the resourcePreEvent is fired.
Let’s look at the example code. This time I removed some boilerplate code and the other events to make things a bit more readable.
const main = async () => {
  // ...

  const resourceSpans = new Map()

  // ...

  await stack.up({
    onEvent: (event) => {
      // ...

      if (event["resourcePreEvent"] !== undefined) {
        const { metadata } = event.resourcePreEvent
        resourceSpans.set(metadata.urn, {
          spanId: id`span`,
          startTimestamp: Date.now(),
        })
        return
      }

      if (event["resOutputsEvent"] !== undefined) {
        const { metadata } = event.resOutputsEvent

        const serviceName = metadata.urn.split("::")[3]
        const { spanId, startTimestamp } = resourceSpans.get(metadata.urn)
        const parentUrn = metadata.new?.parent ?? metadata.old?.parent
        const parentId = resourceSpans.get(parentUrn)?.spanId ?? runStackSpanId

        const hnyEvent = hny.newEvent()
        hnyEvent.timestamp = new Date(startTimestamp)
        hnyEvent.add({
          name: metadata.op,
          service_name: serviceName,
          "trace.trace_id": traceId,
          "trace.parent_id": parentId,
          "trace.span_id": spanId,
          duration_ms: Date.now() - startTimestamp,
        })

        if (metadata.op === "update")
          hnyEvent.addField("diffs", metadata.diffs.join(", "))

        hnyEvent.send()
        return
      }

      // ...
    },
  })
}
So, what’s going on here?
First, the resources are deployed by their hierarchy, but siblings can be deployed in a different order. That’s why we need to save their spanId and startTimestamp when we get a resourcePreEvent.
I used a Map for this and keyed it with the URN of the resource because URNs are used for parent-child relationships and are part of all events we care about here.
Later, when the resOutputsEvent fires, it’s time to wrap it all up and send it to Honeycomb.
The event has the URN to find the related spanId and startTimestamp. We can also use the URN in the parent attribute of our resource to fetch the spanId of our resource’s parent. This way, our spans are correctly nested in Honeycomb later.
If the operation for the resource is an update, we also add the diffs to that event. This way, we can see in Honeycomb what inputs have changed since the last deployment.
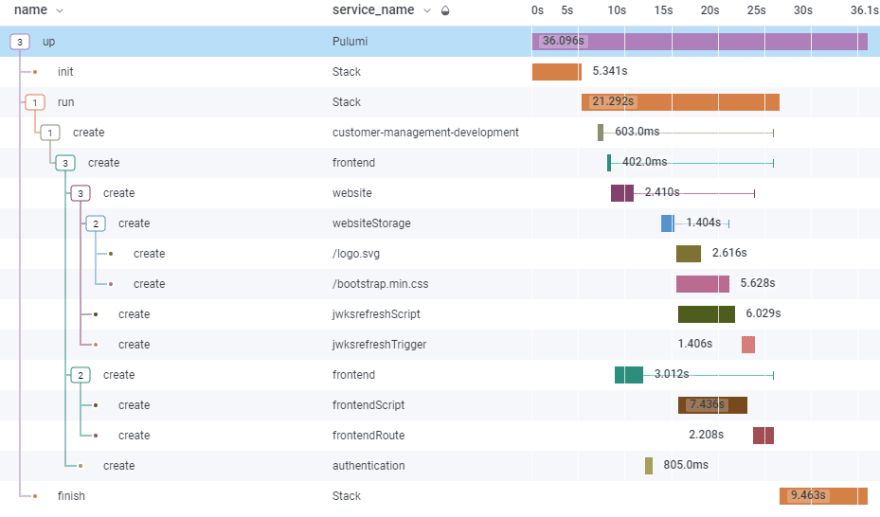
The final trace should look a bit like this:
Getting Errors
The last step, getting deployment errors, I leave as an exercise for the reader.
But I’ll give you a few hints!
First, the interesting event is the diagnosticEvent, which comes with a severity and message attribute. If you only need errors, you have to filter out debug and info severity.
Also, the event includes an urn that can be used to correlate the error to a Honeycomb span later (resourceSpans etc.). If the errors isn’t related to an URN, you can simply use the run stack event as target.
If you add an error field to a Honeycomb event, it will automatically counted to your errors in Honeycomb.
Summary
IaC observability becomes rather simple when using Pulumi and Honeycomb.
Pulumi’s automation API allows us to control the CLI with JavaScript, and Honeycomb’s Libhoney is low-level enough to instrument every part of our deployment process.
This way we can keep track which resources are slowing our deployment down, or which was responsible for a failed deployment.
This article was originally posted at https://dev.to/fllstck/observable-infrastructure-as-code-52ha. Reposted here with permission.


