
For many of us, life is suspended between presses of the F5 key. Our IDE is the only place where everything is organized and makes sense. And while we know that the likelihood of a code hole-in-one is very rare (that magical moment where you run your build and everything just works the first time), we always hope that this time, this will be the run where you see the output that lets you know you’ve gotten it right. And in between? Debugging.
Debugging is a complicated topic. But what is not complicated is understanding the cost of debugging. Debugging is the biggest unknown-unknown in software. It makes you miss your sprint goals, it holds back scaling and company growth, it slows your time to market. Debugging is what makes estimating so difficult, because until you know what the problem is, you don’t know how long it will take to fix, or indeed if it is even possible to fix at all. Which is why savvy developers invest a lot of time into refining their debugging process and seek out the best-in-class tools to streamline this process.
In the infrastructure world, debugging is a pretty big problem. Some of the most popular tools have nothing more than simple unstructured text output logs. While tools like Terraform call themselves “Infrastructure as Code” the “code” is a proprietary DSL, not a general purpose programming language, and so there is little-to-no IDE support. There is no F5. Even worse, there is no F9 for setting a breakpoint. There’s no way to inspect state mid-run, or more importantly to explore in an unstructured way, because this is where the “aha!” moments usually happen.
Pulumi gives you a rich IaC debugging experience by enabling breakpoint debugging in your favorite IDE. Let’s walk through an example of how to enable a full-featured debugging workflow in VS Code for TypeScript.
How Breakpoint Debugging Works
Using a debugger can feel like that moment in The Matrix where Neo first sees the green streaming code raining down. A debugger lifts the veil from your otherwise opaque executable code. Tools like VS Code provide a user experience where you set breakpoints, i.e. certain lines of code that are designated as points where you want to pause execution and inspect state. Hitting the F9 key in VS Code sets a breakpoint on the current line of code. Later, you run your code in debug mode. This is a special execution state where the underlying runtime (e.g. Node’s V8) exposes a TCP/IP port hosting a debugging protocol, and when run, it will pause execution until something attaches to it (i.e. connects to the port to start the debugging session).
At this point a debugging client (such as VS Code) will control the flow of the program, moving forward step-by-step, one line of code at a time. But how does it know which line of code it’s executing? When you run in debug mode, the binary code is instrumented with metadata about the line of code it represents. The debugger will tell the runtime, via the debugging protocol, “run until you reach line 109 in file data.ts, then pause and wait for a signal from me before continuing”.
While paused, the protocol also allows you to inspect the values of any variables that are in scope at that moment. A more sophisticated debugger will provide a REPL environment where you can execute ad-hoc code in the scope of the line where you are paused. This can be very powerful to inspect the values of various objects and to see in real-time what the effects of executing variations of code would be. After a debugging session you can take what you’ve learned and edit the code accordingly.
Example: Attaching a debugger to a TypeScript Pulumi program in VS Code
For this example, we will set up a new Pulumi project from the command-line and then set up VS Code to run that program in a debugger.
Step 1: Create a Pulumi project from a template
For this example, we will create a new Pulumi project using the TypeScript AWS static website template. Make sure you’ve set up Pulumi, logged into Pulumi Cloud, and configured your AWS credentials. Follow the prompts in the pulumi CLI to configure your project.
$ mkdir good-morning && cd good-morning
$ pulumi new static-website-aws-typescript
Then launch this project to make sure it works as expected:
$ pulumi up
...

Updating (dev)

View in Browser (Ctrl+O): https://app.pulumi.com/troy-pulumi-corp/good-morning/dev/updates/1

     Type                                   Name                 Status
 +   pulumi:pulumi:Stack                    good-morning-dev       created (200s)
 +   ├─ aws:s3:Bucket                       bucket               created (1s)
 +   ├─ aws:s3:BucketPublicAccessBlock      public-access-block  created (0.57s)
 +   ├─ aws:s3:BucketOwnershipControls      ownership-controls   created (1s)
 +   ├─ aws:cloudfront:Distribution         cdn                  created (196s)
 +   └─ synced-folder:index:S3BucketFolder  bucket-folder        created (0.41s)
 +      ├─ aws:s3:BucketObject              error.html           created (0.46s)
 +      └─ aws:s3:BucketObject              index.html           created (0.46s)

Outputs:
    cdnHostname   : "##############.cloudfront.net"
    cdnURL        : "https://##############.cloudfront.net"
    originHostname: "bucket-#######.s3-website-us-west-2.amazonaws.com"
    originURL     : "http://bucket-#######.s3-website-us-west-2.amazonaws.com"

Resources:
    + 8 created
Great! You should be able to navigate to the website using the URL from the cdnURL output value.
$ open $(pulumi stack output cdnURL)
If all looks good, let’s move on to the next step by opening your project directory in VS Code:
$ code .
Step 2: Lets break stuff!
Now that we have a perfectly running Pulumi program, in order to have something to debug, we will need to break it!
For this example, we are going to change our indexDocument from index.html to good-morning.html.
$ cp ./wwww/index.html ./www/good-morning.html
Next, let’s edit the contents to say “Good morning, world!” instead of “Hello, world!”:
<!DOCTYPE html>
<html lang="en">
<head>
    <meta charset="utf-8">
    <title>Good morning, world!</title>
</head>
<body>
    <h1>Good morning, world! 👋</h1>
    <p>Deployed with 💜 by <a href="https://pulumi.com/">Pulumi</a>.</p>
</body>
</html>
Once that’s edited and saved, go ahead let’s redeploy the website:
$ pulumi up
Everything runs successfully… but if we navigate to the website, we don’t see our updated content?! Oh no! What went wrong? Why isn’t there an error message?! Time to put on our debugging hats and figure out what is going on. First, let’s set up VS Code to enable breakpoint debugging right in the IDE.
Step 3: Create a debug wrapper script
VS Code can run an arbitrary command when you hit F5. Typically this would be a one-liner that runs your language runtime like node foo.js or python foo.py. In our case, we need to run the pulumi CLI and need to do more than one step. The easiest way to do this is to create a small wrapper script and call that from VS Code.
In the root of the directory, create a file called pulumi-debug.sh:
#!/bin/bash

pulumi login
pulumi stack select dev
pulumi up -f
Let’s walk through these lines to explain what’s going on here:
pulumi loginto set up credentials for the pulumi backendpulumi stack select devto run this against ourdevstackpulumi up -fto run our program update. The -f flag skips the preview phase and also skips the need to interactively confirm that we want to run the update.
Open the VS Code terminal panel and first set it to be executable, then try running the script:
$ chmod +x pulumi-debug.sh
$ ./pulumi-debug.sh
Ok now let’s set up VS Code to run that in debug mode when we hit F5!
Step 4: Configure VS Code launch.json and tasks.json
To run our Pulumi program in debug mode we will need to create a couple of VS Code configuration files, launch.json and tasks.json, in a hidden directory called .vscode within your project.
Create the .vscode directory and then create a new file called tasks.json file in that directory, with the following contents:
{
	"version": "2.0.0",
	"tasks": [
	    {
			"label": "pulumi-debug",
			"type": "shell",
			"command": ". ./pulumi-debug.sh",
			"isBackground": true,
            "options": {
                "cwd": "${workspaceFolder}"
            }
		}
	]
}
This creates a VS Code task named pulumi-debug which will run the wrapper script we just created from the root of our project.
Next, create a file named launch.json in the same directory. This will configure the behavior of the F5 key!
{
    "version": "0.2.0",
    "configurations": [
        {
            "name": "Launch Pulumi Program (debug)",
            "type": "node",
            "port": 9292,
            "request": "attach",
            "preLaunchTask": "pulumi-debug",
            "continueOnAttach": true,
            "restart": {
                "delay": 5000,
                "maxAttempts": 5
            },
            "skipFiles": [
                "${workspaceFolder}/node_modules/**/*.js",
                "${workspaceFolder}/lib/**/*.js",
                "<node_internals>/**/*.js"
            ]
        }
    ]
}
Let’s break this down a bit:
type: nodetells VS Code that we are using the Node runtimeport: 9292tells VS Code to attach the debugger to port 9292request: attachtells VS Code that we want to attach to the debugger at launchpreLaunchTask: pulumi-debugtells VS Code to run the task we configured intasks.jsonbefore we connect the debugger. This will run ourpulumi-debug.shscript and then attach to the Node.js runtimecontinueOnAttach: truetells VS Code to start running our code as soon as we attach to the waiting Node.js runtime (until we reach our first breakpoint that is, where it will pause and return control to the debugger client, aka VS Code)restart: {...}configures VS Code to wait 5 seconds and then retry connecting, up to 5 times. This is here in case it takes a while for the Node.js runtime to start running. It’s unlikely, but possible!skipFiles: {...}sets up some filters of files not to try to debug. This includes everything that is part of node’s internals, 3rdparty node modules, and other libraries. That way we don’t end up deep in someone else’s code unexpectedly and can just focus on our Pulumi program.namesets a human-readable name which shows up in the drop down box in VS Code when you choose which [launch configuration][vs-code-launch-configs] to run.
Finally, we need to make one more edit to the pulumi-debug.sh file we created. Here we will pass the necessary options to the Node.js runtime to set it to run in debug mode.
Add the following line to the beginning of the file:
#!/bin/bash

export NODE_OPTIONS='--inspect-brk=127.0.0.1:9292'

pulumi login
pulumi stack select dev
pulumi up -f
NODE_OPTIONS environment variable passes options to the Node.js V8 runtime. In this case, we are passing --inspect-brk which tells the Node.js runtime to run in debug mode, which will cause it to pause before running the code, until a debugging client connects to localhost on port 9292.Ok, now we should be ready to run our Pulumi program from VS Code using the F5 key! Let’s give it a try. You should see Pulumi running inside of the “Terminal” tab. You will also see output indicating that it is waiting for a debugger to attach:
Debugger listening on ws://127.0.0.1:9292/########-####-####-####-############
For help, see: https://nodejs.org/en/docs/inspector
Debugger attached.
Waiting for the debugger to disconnect...
Step 5: Setting a debugging breakpoint
Now we can try setting a breakpoint in our code. Getting back to the problem at hand – our content doesn’t seem to be updating, despite no errors. Let’s start at the beginning, by investigating the inputs to our program, aka our configuration… at runtime!
Navigate to line 12 within the code and hit the F9 key. You’ll see a small red dot appear next to the line indicating that a breakpoint has been set. This line defines the bucket our program creates and seems like a good place to stop if we want to check the input configuration before we run the AWS S3 provider call.
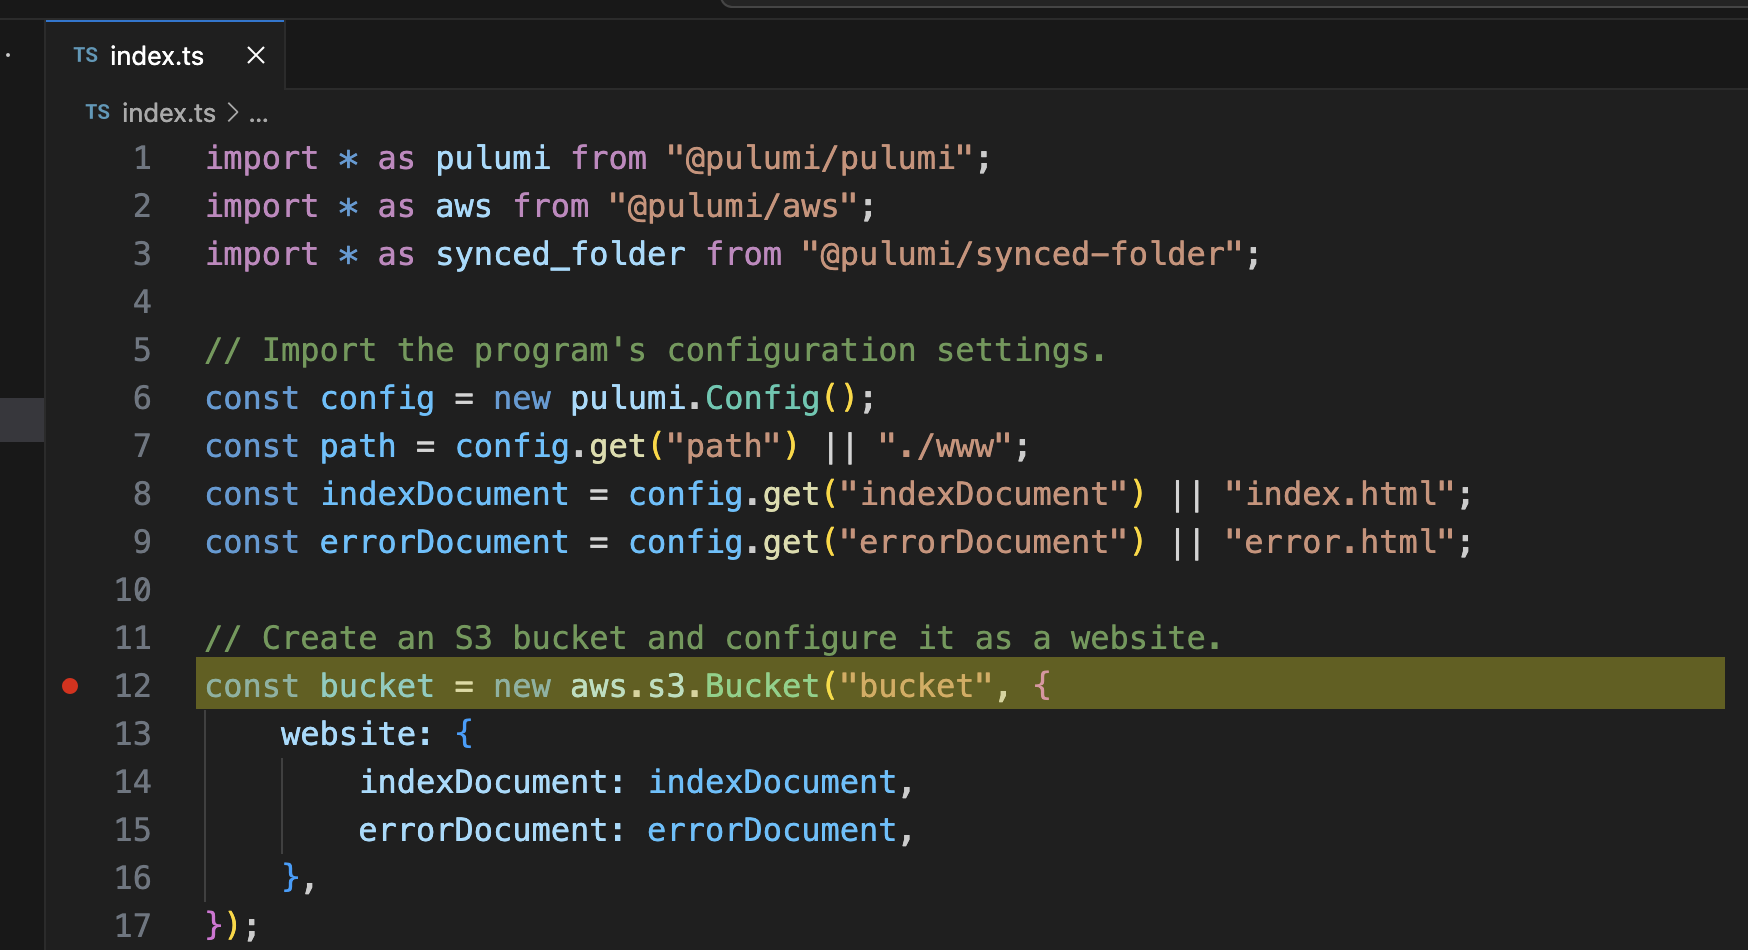
Figure: A breakpoint set on line 12.
You can then run the program again using F5. When the execution of the code reaches the line it will pause there. At this point you can navigate around the code inspecting the state of the local variables, like you would in any other debugging session.
Let’s inspect the configuration variables. On the left side of the screen you’ll find a “Variables” panel listing all the local variables that are in scope.
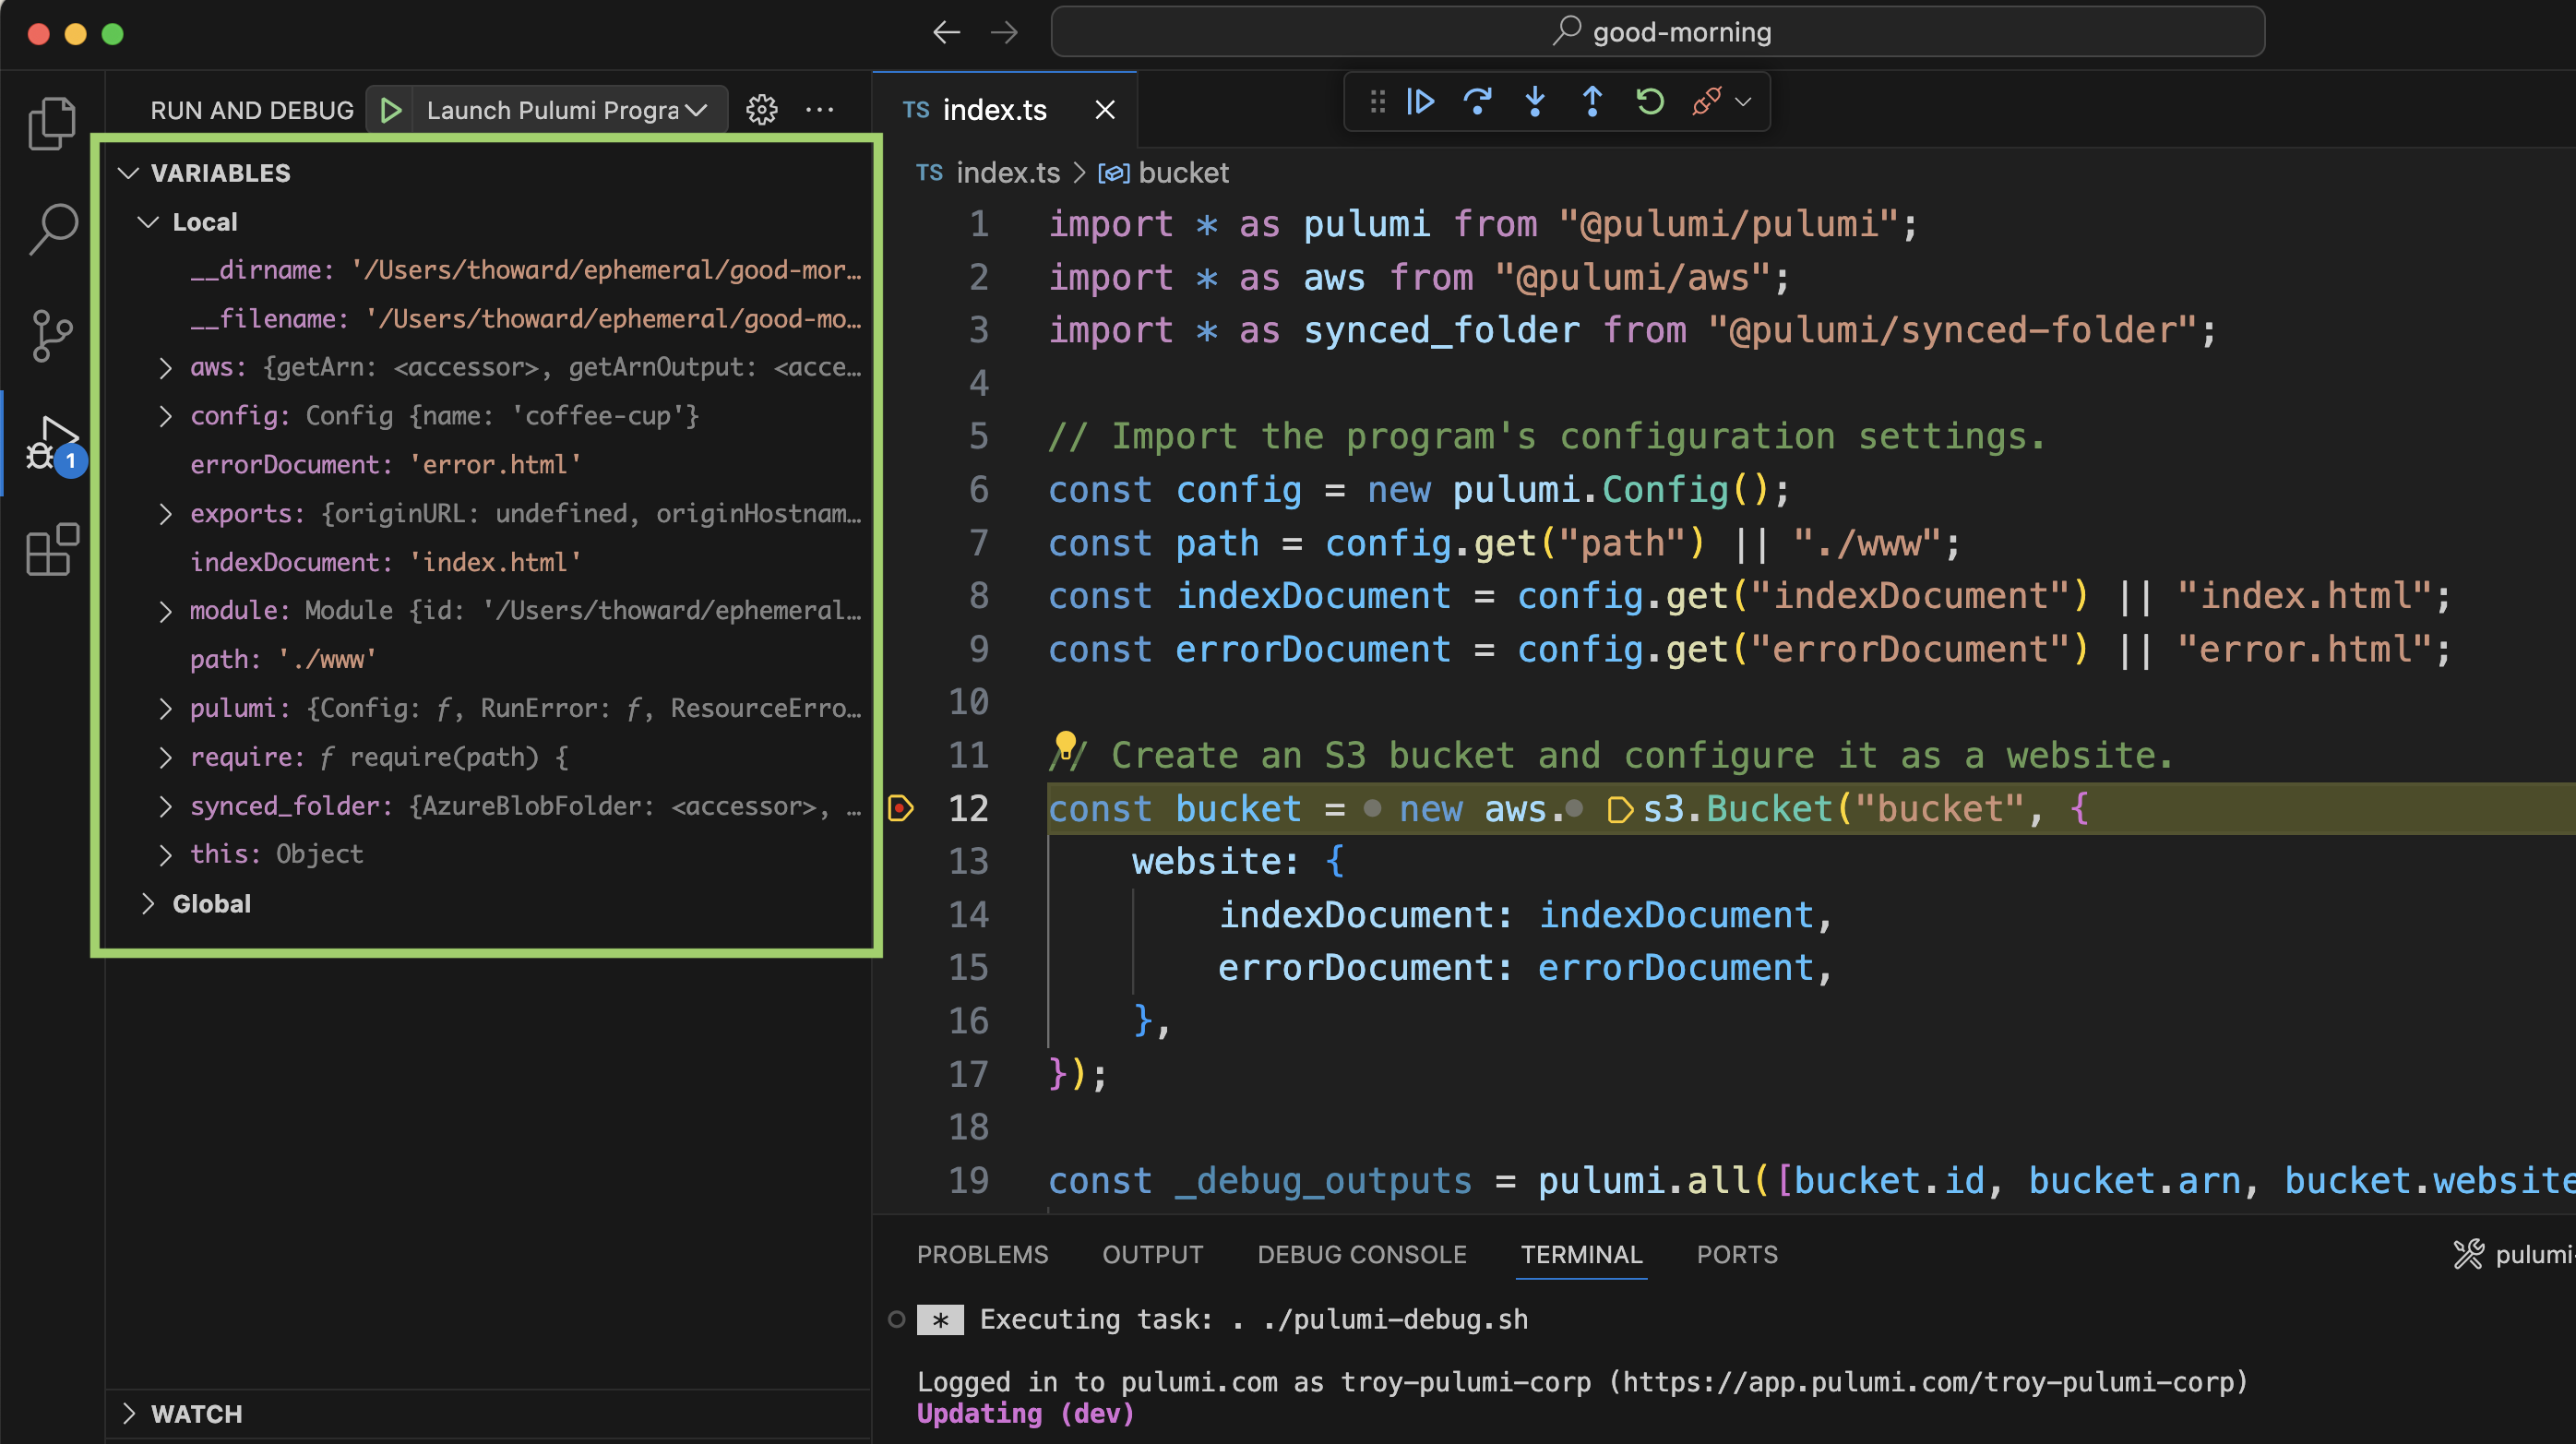
Figure: Local variables displayed in the Variables side panel.
There’s also the “Debug” console which provides a REPL environment to navigate those variables and anything else that is in scope. You can run arbitrary functions here and see their output. In this case we can simply type the variable name at the prompt there, hit enter, and see the value. What’s great about the debug console is that Intellisense (e.g. using TAB to auto-complete) works here, so you can quickly navigate possible options.
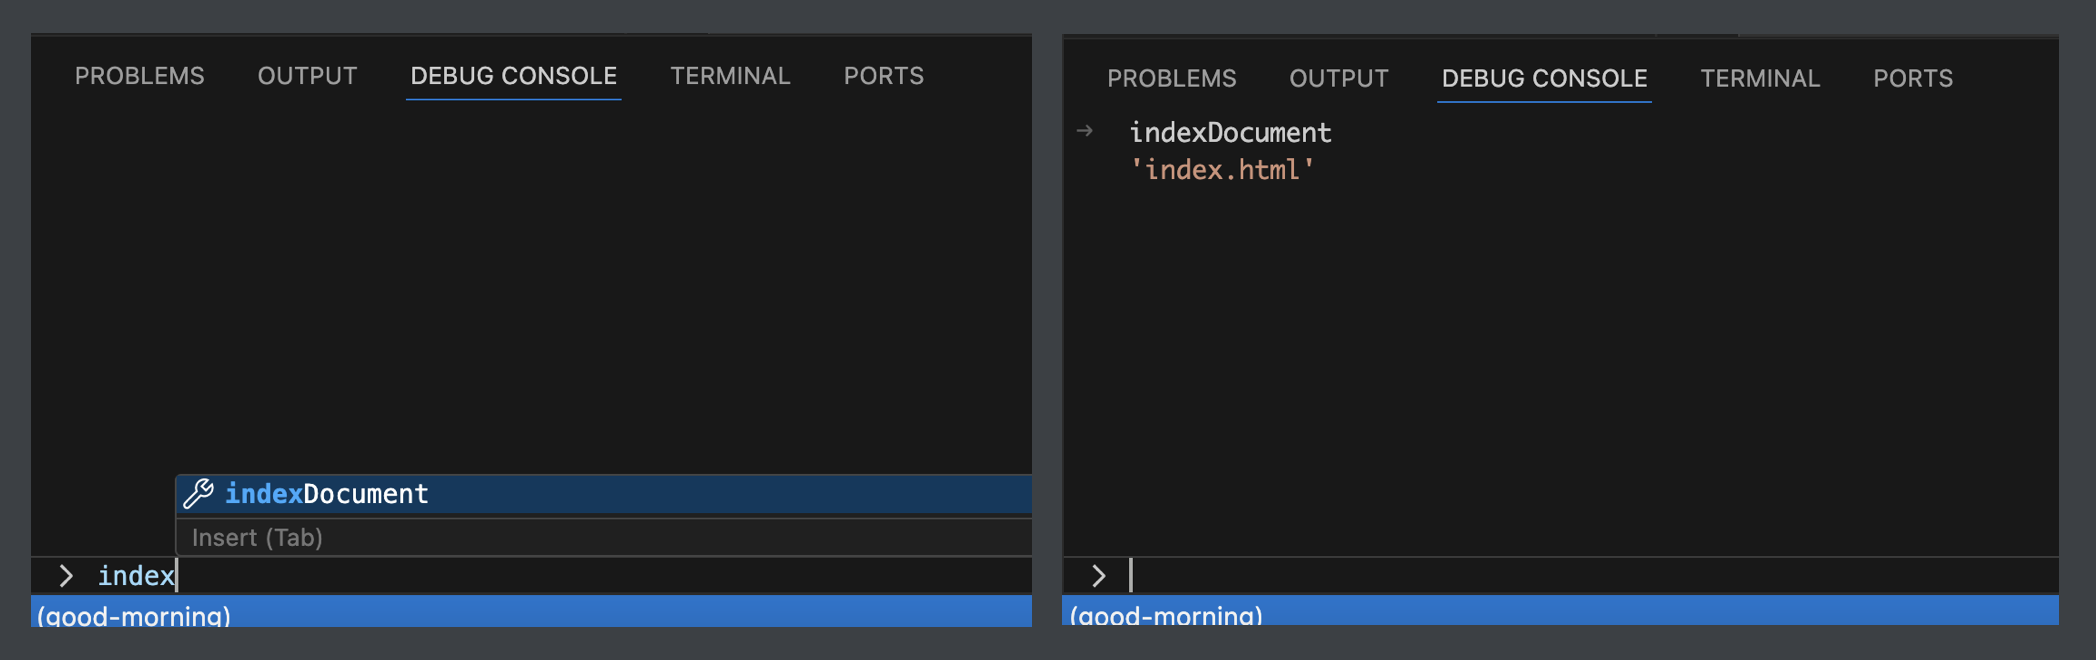
Figure: Debug console tab completion and inspecting variable values.
In our case, we’re interested in the value of indexDocument variable. We can see that it is getting set to index.html… not good-morning.html. The Pulumi program didn’t error because index.html still exists. So we are still publishing our old index.html. That makes sense. A quick fix here is to modify index.ts and set the default to good-morning.html:
import * as pulumi from "@pulumi/pulumi";
import * as aws from "@pulumi/aws";
import * as synced_folder from "@pulumi/synced-folder";

// Import the program's configuration settings.
const config = new pulumi.Config();
const path = config.get("path") || "./www";
const indexDocument = config.get("indexDocument") || "good-morning.html";
const errorDocument = config.get("errorDocument") || "error.html";

...
Ok, we edited the document, which fixes the program for future runs, but for the current run that we are debugging, indexDocument is still set to index.html. Let’s use the debug console to set the value to good-morning.html before we continue the run.
> indexDocument="good-morning.html`
The output in the debug window will show the new value, and if you hover over the inputs being passed to the bucket creation call, it will now show as good-morning.html:
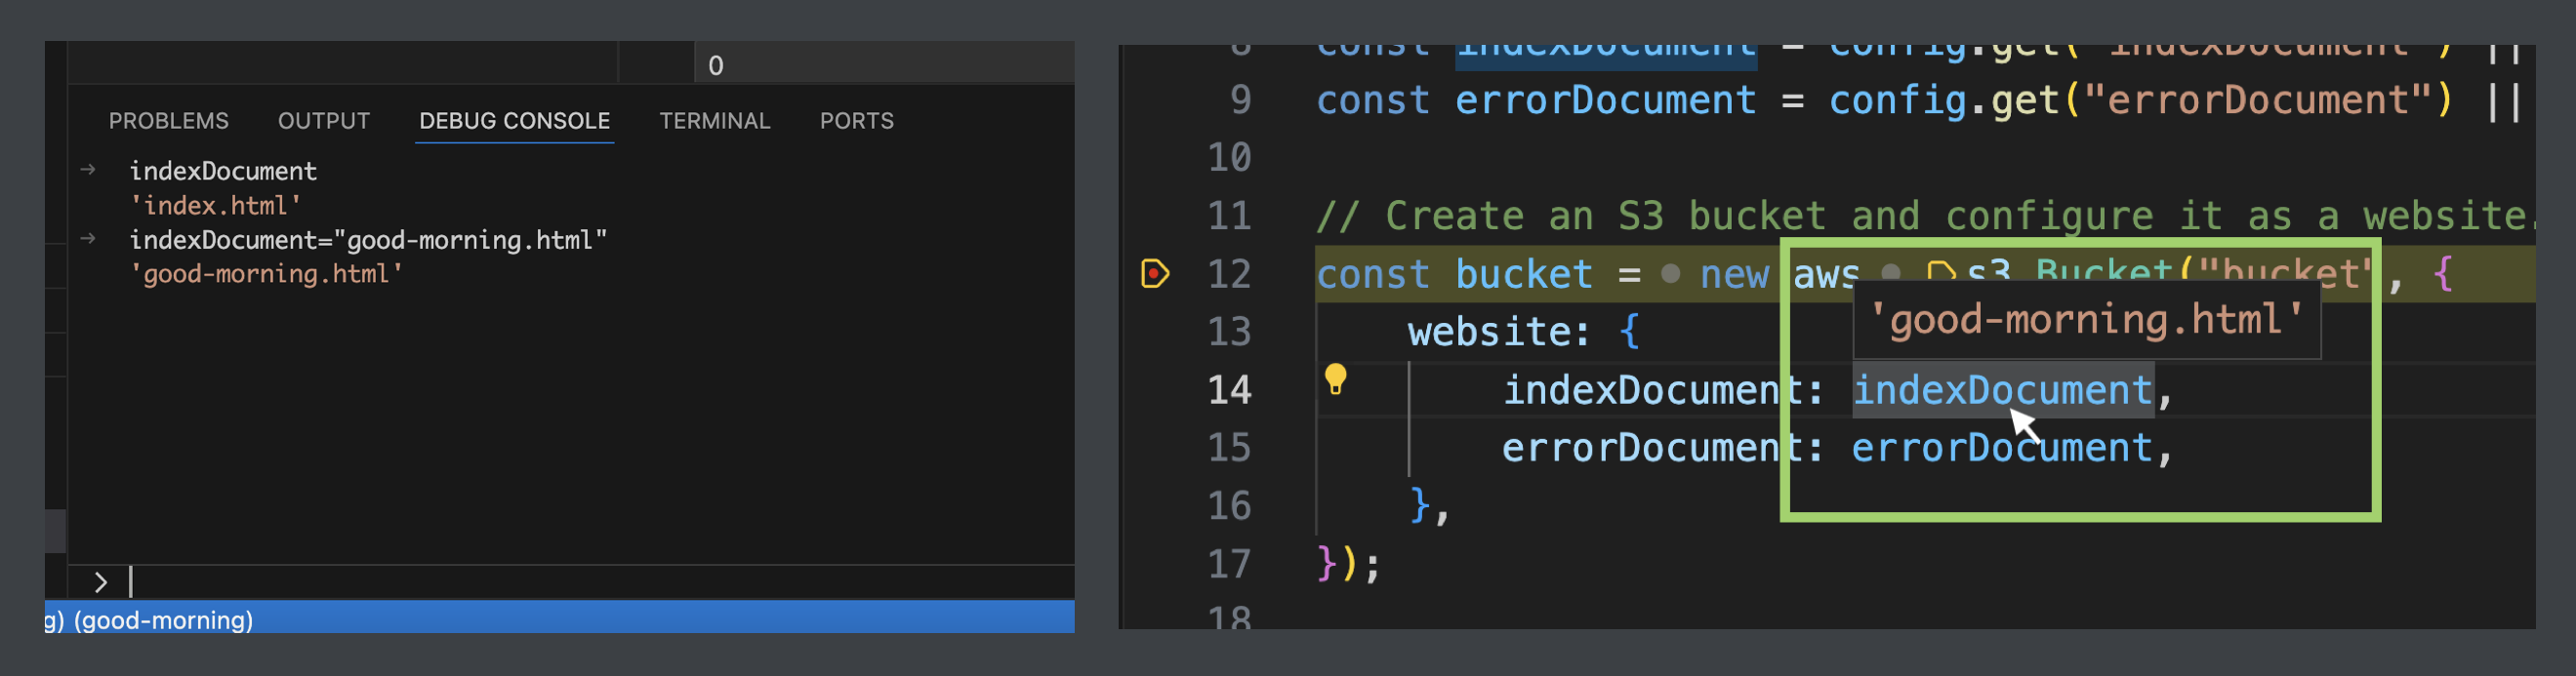
Figure: Screenshots of debug console and editor window after changing the indexDocument variable
When you’re ready for the program to continue on, hit F5 once again and the program will resume operation, either until the program exits or until it reaches the next breakpoint. Optionally you can step through line-by-line using the F10 key. VS Code provides a variety of debug actions once the session is established.
Most importantly, check the published website and make sure we fixed the issue! You can find the cdnURL output in the Terminal tab and click on it from there to open the link.
Considerations and Limitations
Breakpoint debugging is a powerful tool for inspecting the state of your Pulumi program. However, there are some important limitations to consider:
Pulumi programs are only part of the story: This technique will let you inspect the program you authored, but it doesn’t give access to what’s happening with the Pulumi backend, the providers, or anything else outside of the program itself. You might find yourself needing to dig deeper to resolve a problem with the stack as a whole. Luckily there are other techniques we can use for that, which we will delve into in an upcoming post.
Inputs and Outputs are asynchronous futures: If you’ve used Pulumi before you will have encountered
Input<T>andOutput<T>values, which are a core function of the tool. However, at the time that the debugger hits a breakpoint on those values, they are likely not populated with their final value. That means you won’t be able to inspect them in the debugger very well. Instead, you will need to add anapply(...)orall(..)block to the code, and place the breakpoint on the materialized value within that block. This follows all the same rules as accessing those variables in code in a Pulumi program.bucket.id.apply(id => { // NOTE: The `debugger` keyword automatically sets a breakpoint here // so you don't need to set it via the IDE. debugger });Limited integration with VS Code: Unfortunately our technique of running Pulumi in wrapper script as a backgrounded pre-launch task in VS Code leaves some things to be desired. It is different enough from the use case that VS Code had in mind for these features (e.g. interacting with a long-running
tsc-watchor similar task) that making things “just work” is a little difficult. For example, we can’t easily report on errors in the “Problems” tab, and VS Code complains that a problem matcher is missing the first time you run it. VS Code can’t tell that the program finished and so you’ll have to manually stop the debugging session after Pulumi has completed (or wait for the retry/timeout to expire).
Despite these limitations, Pulumi with VS Code as your IDE provides a rich experience compared to trawlling through unstructured logs, or adding in console.log(...) calls to echo out ad-hoc debugging information (aka. printf debugging). Also, you can enable this for any language that Pulumi supports, and most popular IDEs support breakpoint debugging (e.g. Visual Studio, Webstorm, neovim, etc). Python, Go, and C# all have popular debuggers and IDEs that can be used in the same manner. Whatever your preferred IDE or language is, you can use their full range of breakpoint debugging features for your Pulumi programs.
Pulumi also offers detailed logging which can be used to look into the other aspects that breakpoint debugging doesn’t cover. In an upcoming article we’ll show how to use these tools as well. Until then, have fun spelunking through your code with your favorite IDE!
Next Steps
If you haven’t already, install Pulumi today, and follow our self-directed Getting Started guides to learn more about making the most of Pulumi’s next-level infrastructure management features at your organization.
To learn more, you can watch the following video which provides a high level overview of how Pulumi works:
Pulumi Cloud
The Pulumi Cloud is a fully managed service that helps you adopt Pulumi’s open source SDK with ease. It provides built-in state and secrets management, integrates with source control and CI/CD, and offers a web console and API that make it easier to visualize and manage infrastructure. It is free for individual use, with features available for teams.


