


Attaching a debugger to a Pulumi program
Because Pulumi uses general-purpose programming languages to provision cloud resources, you can take advantage of native debugging tools to troubleshoot your infrastructure definitions.
You can’t directly F5-launch your Pulumi program from your IDE. Instead, you run the Pulumi CLI, which launches your program through its language runtime in a separate process, and then you attach to that process from your IDE. See How Pulumi works to learn more about the Pulumi execution model.
Debugging with Visual Studio Code and the Pulumi extension
Pulumi provides a VS Code extension that you can use to launch and debug Pulumi programs.
Install the extension
Install the Pulumi extension using Visual Studio Marketplace.
Open a project
Open a new or existing Pulumi project as a VS Code workspace. The extension supports both single-folder workspaces and multi-root workspaces.
Start debugging
Pulumi programs are run (with or without debugging) using a launch configuration. Select the Run and Debug icon in the Activity Bar on the side of VS Code, then use an automatic debug configuration or create a launch configuration file for your project.
The extension automatically generates a debug configuration to run pulumi up or pulumi preview for the current Pulumi stack. To use an automatic debug configuration, do the following:
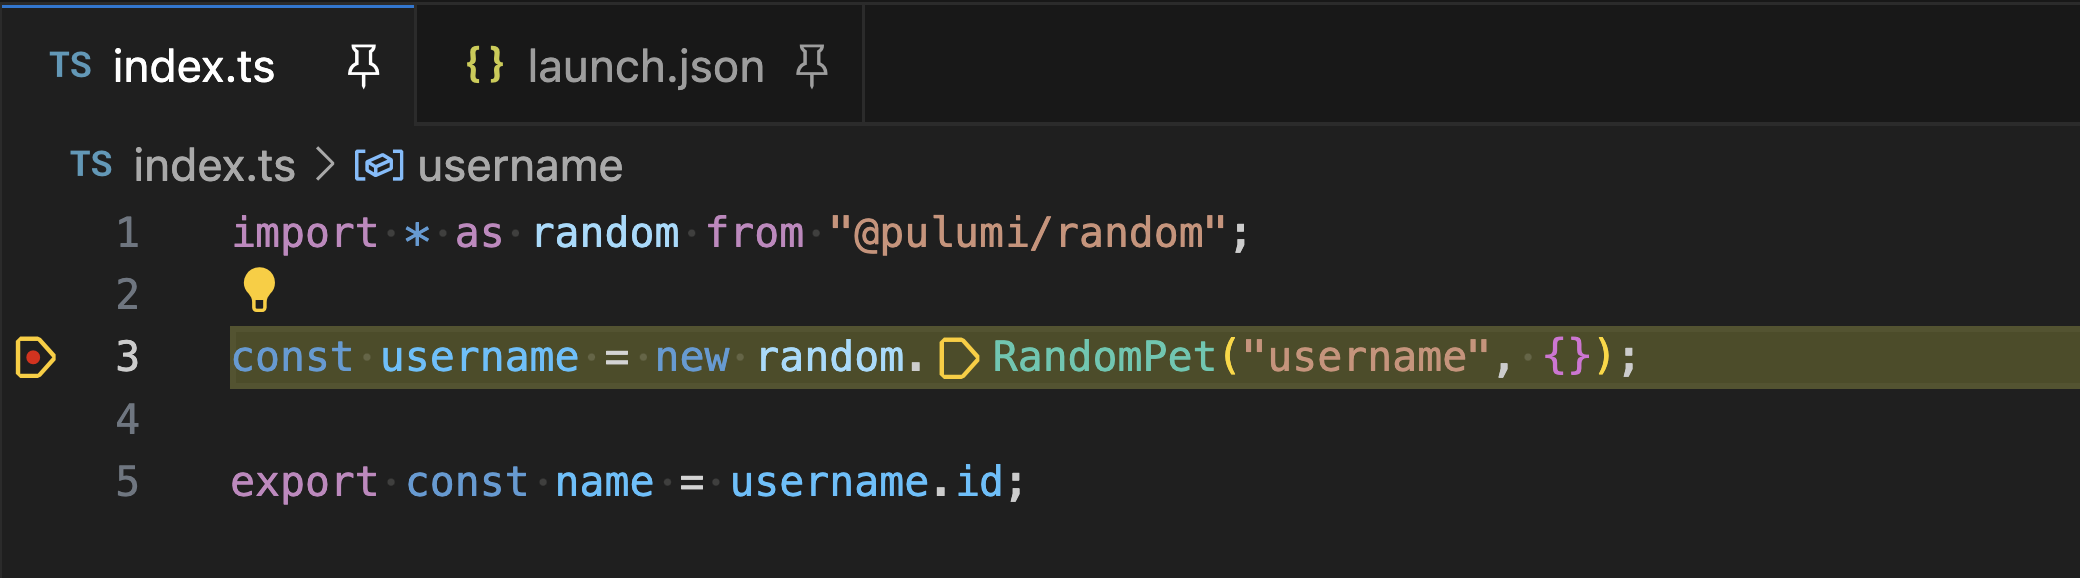
Open your program file in VS Code and set a breakpoint.
Select the Run and Debug icon.
Choose Show all automatic debug configurations.
Select Pulumi…, then
pulumi previeworpulumi up. Debugging starts automatically.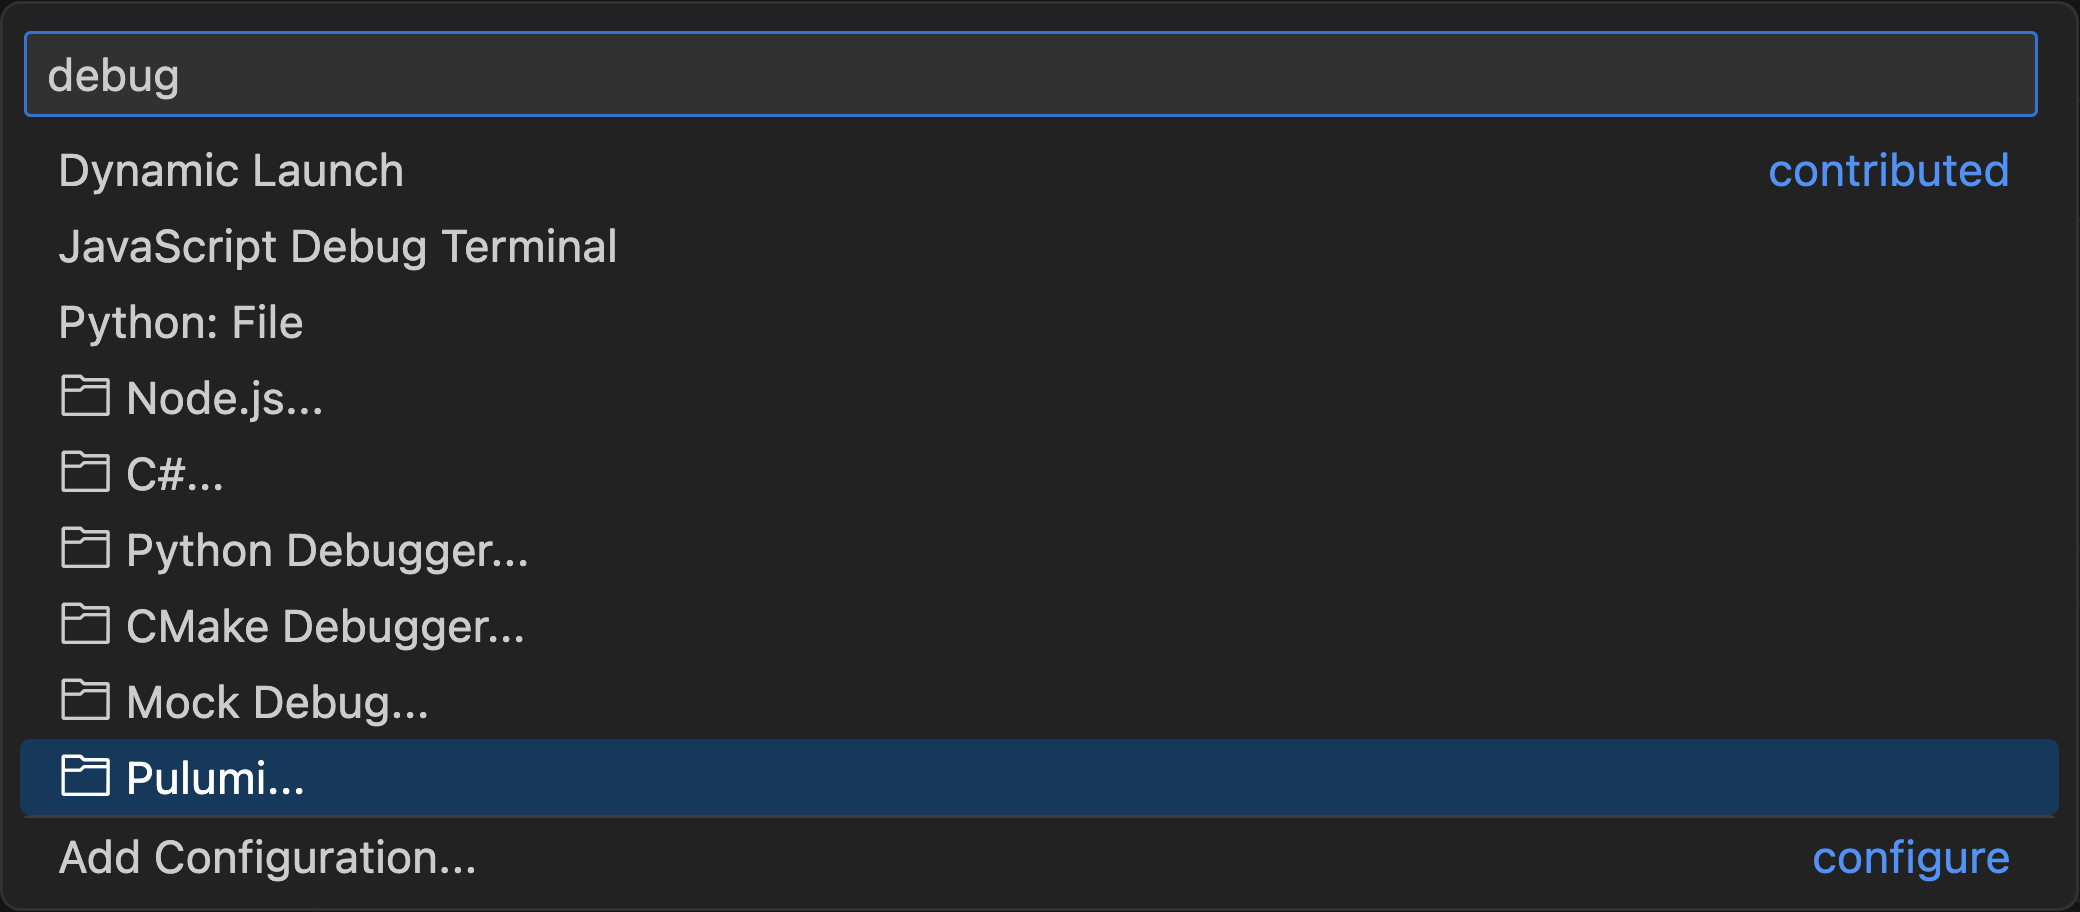

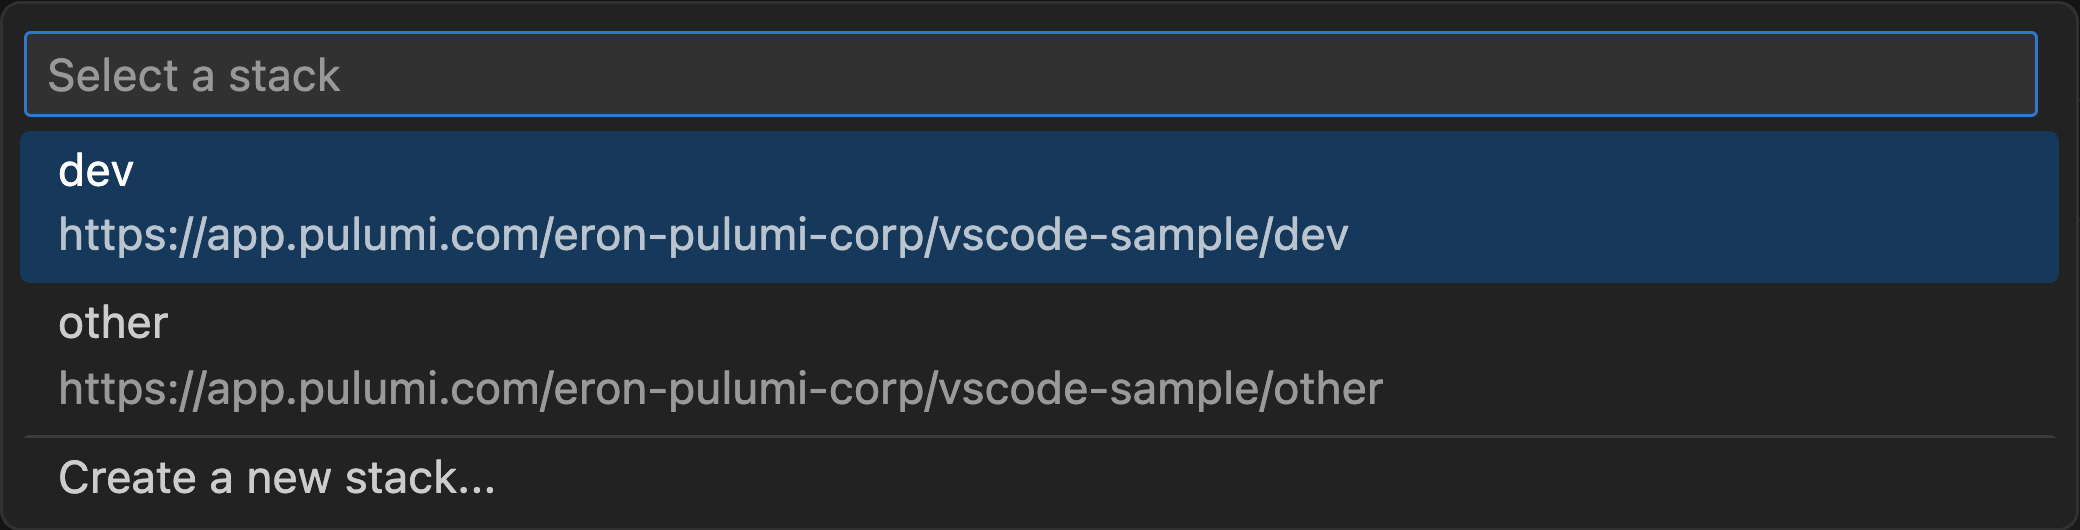
Select or create a stack if prompted to do so.
Debug your program
Set breakpoints in your program code and use the full functionality of the VS Code debugger. See VS Code Debugging for more information.
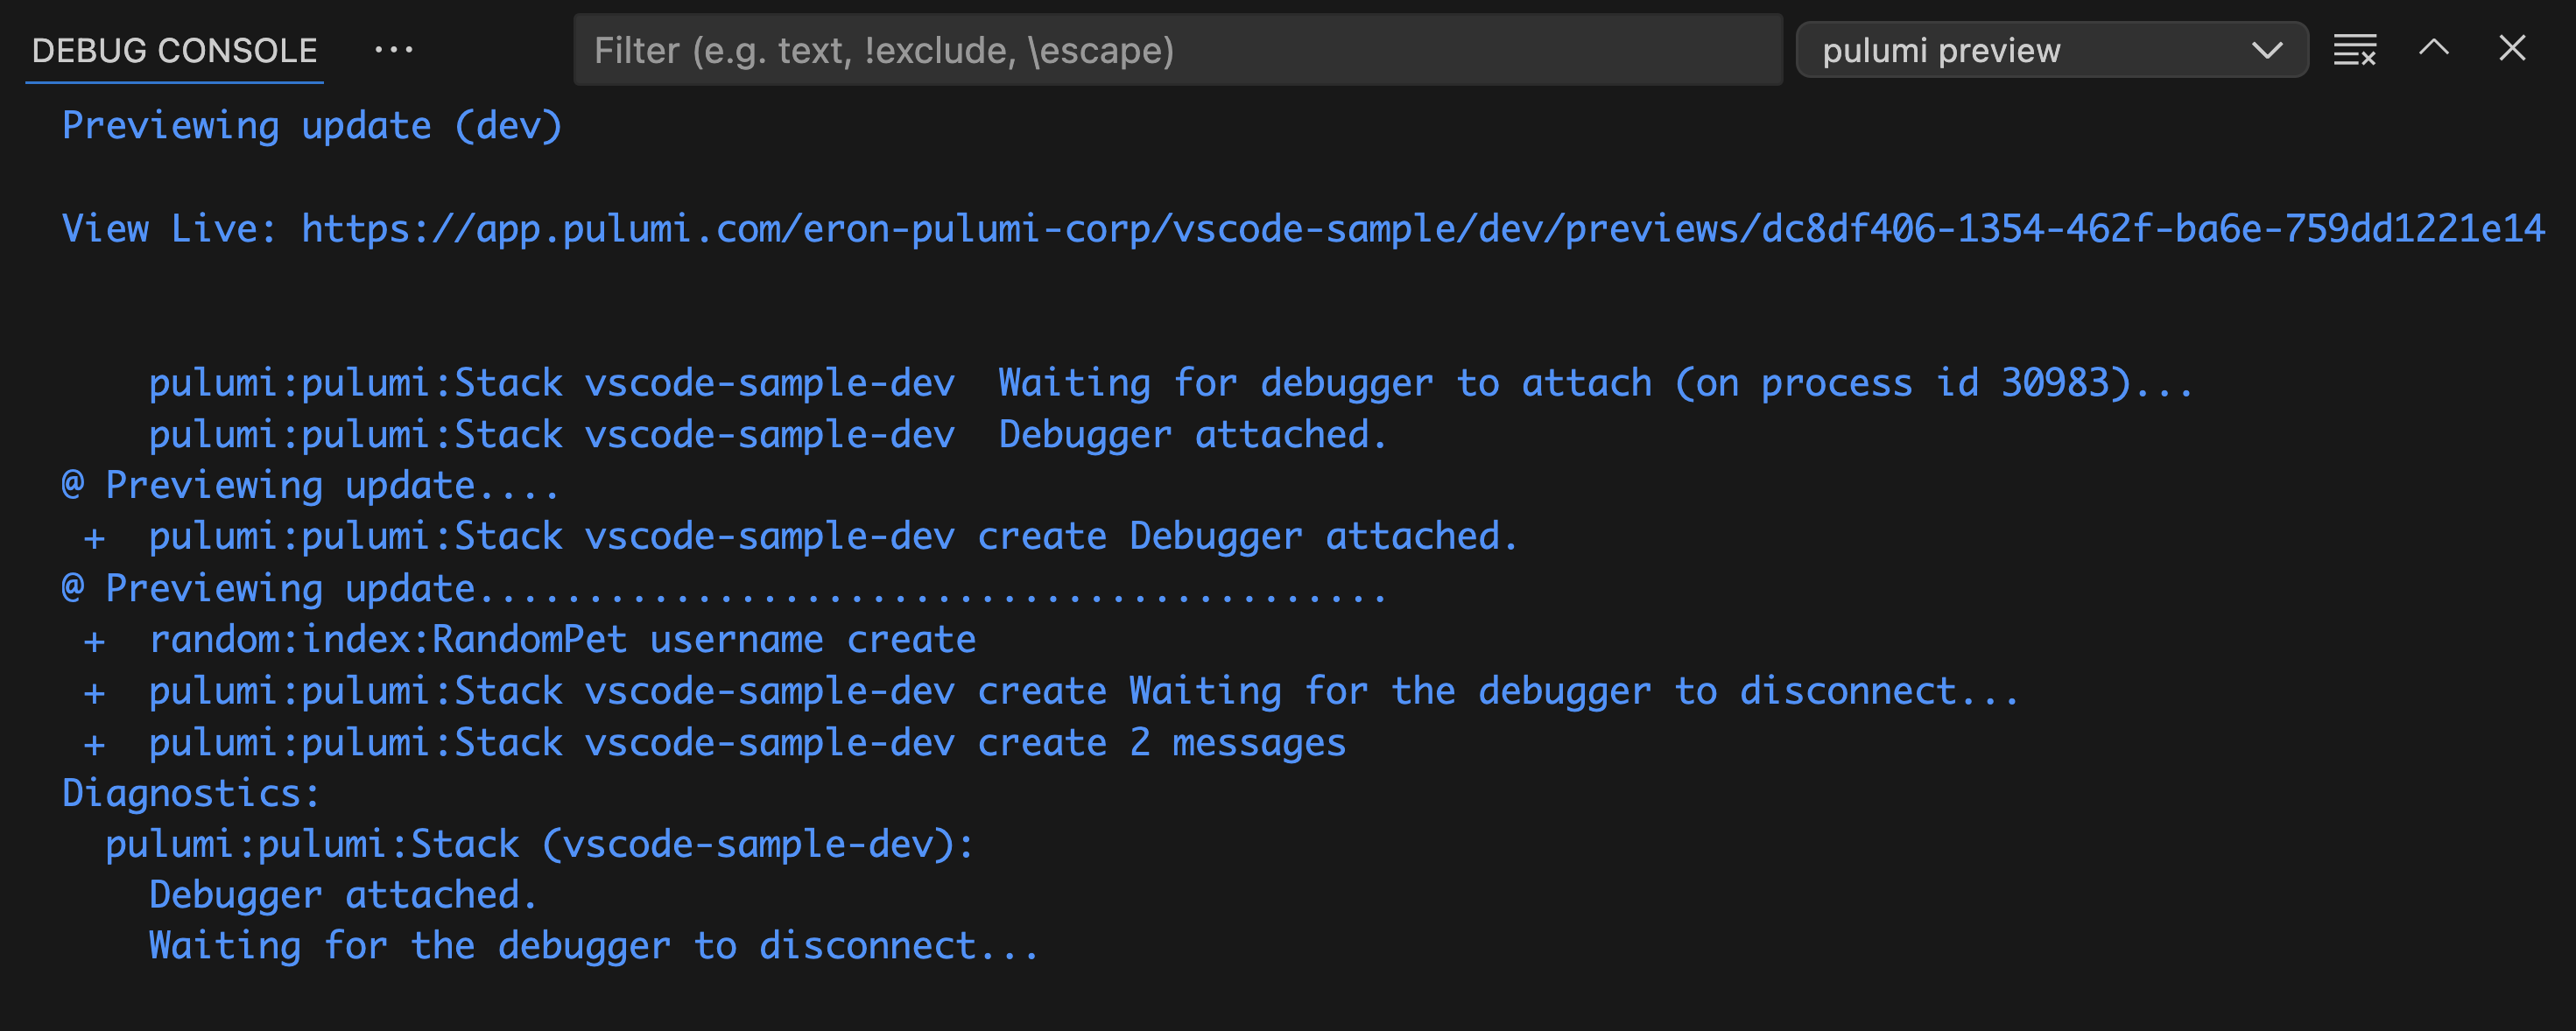
Pulumi CLI output
Access the CLI output via the Debug Console view.
Debugging with other IDEs
You can use any other IDE or editor that supports attaching to running programs using the Debug Adapter Protocol. The tools differ depending on your preference and the language you are using, but the process is similar:
- Start with an existing Pulumi project that contains
Pulumi.yamland your program. - Open your IDE and set a breakpoint in your program.
- Run
pulumi up --attach-debuggerfrom a command line. - Wait until
pulumiis paused waiting for a debugger to attach. - Attach the debugger to a running process of your language runtime.
- Step through the program to find the problem.
- Run the program to completion and let
pulumishut down all the processes. - Change your program and repeat the process if needed.
pulumi up runs your program twice, once for the preview and once for the update, and both runs trigger the debugger. Use pulumi preview --attach-debugger or pulumi up --skip-preview --attach-debugger to pick one of the two modes.
Manual debugger setup
To set up debugging manually for a Node.js program, create or update .vscode/launch.json with the following configuration to enable debugging:
{
    "version": "0.2.0",
    "configurations": [
        {
            "name": "Launch Pulumi Program (debug)",
            "type": "node",
            "request": "attach",
            "continueOnAttach": true,
            "skipFiles": [
                "${workspaceFolder}/node_modules/**/*.js",
                "${workspaceFolder}/lib/**/*.js",
                "<node_internals>/**/*.js"
            ]
        }
    ]
}
Open your program and set breakpoints by clicking to the left of the line numbers.
In a terminal, run NODE_OPTIONS="--inspect-brk" pulumi up to start the deployment process in debug mode. This causes Pulumi to pause execution and wait for a debugger to attach.
Press F5 in VS Code to start debugging. VS Code will attach to the waiting Node.js process, and execution will continue until reaching the first breakpoint you have set.
For a step-by-step guide to attaching a debugger to a Pulumi TypeScript program, see the breakpoint debugging blog post.